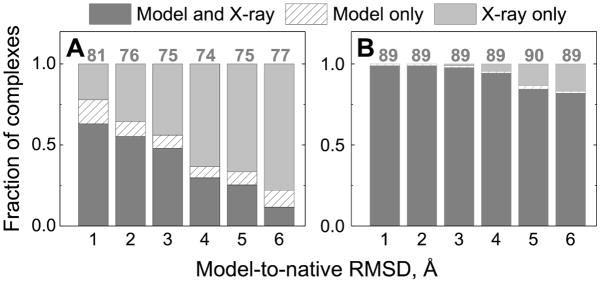
Figure 2. Docking success rates for protein models compared to the success rates for X-ray structures.
Successfully predicted complexes (those for which at least one acceptable or better quality prediction is among the top 10 docking poses), in the free docking (left hand panel) and the template-based docking (right hand panel) are in dark gray. Complexes with successful predictions by the X-ray docking only are in light gray. Complexes with successful predictions by the models docking only are in dashed bars. The quality of the models docking was accessed relative to the “ideal” complexes (see Methods). The data are normalized by the total numbers of complexes in all three categories shown on top of the bars.

