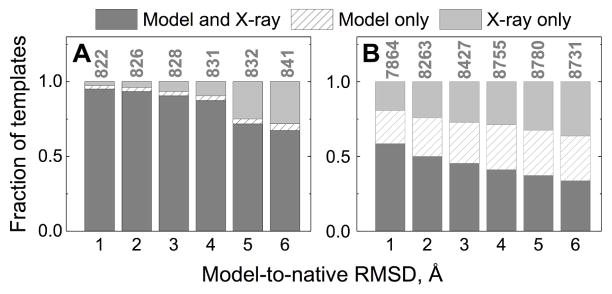
Figure 3. Conservation of templates in template-based docking of models.
Dark gray bars show templates common for the docking predictions of the X-ray structures and docking predictions of the corresponding models. Light gray bars show templates for the docking of the X-ray structures predictions only. Dashed bars show templates for the docking of the models predictions only. Data for good (acceptable or higher quality) predictions (A), and incorrect predictions (B) is normalized by the total number of templates shown on top of the bars.

