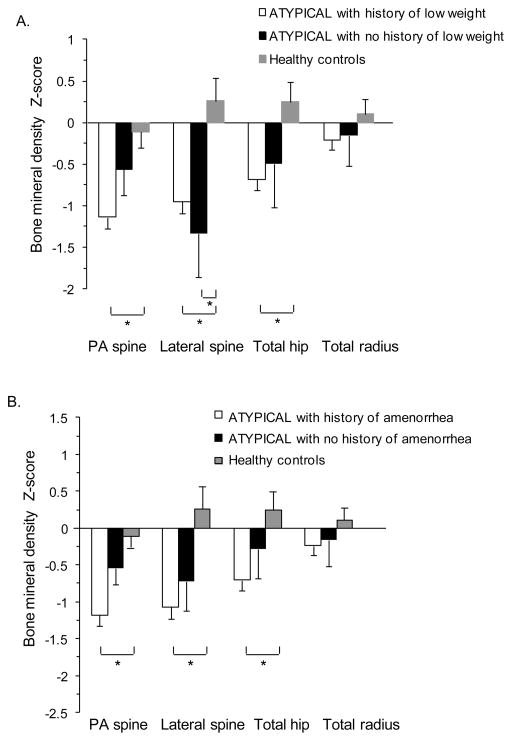
Figure 2.
Mean bone mineral density (BMD) Z-scores of women with atypical anorexia nervosa (AN) compared to a healthy comparison group. A. Mean BMD Z-scores of three groups: 1) atypical AN with prior low weight (defined as BMI <18.5kg/m2), 2) atypical AN without a history of low weight, and 3) healthy women. B. Mean BMD Z-scores of three groups: 1) atypical AN with a history of amenorrhea, 2) atypical AN without a history of amenorrhea, and 3) healthy women. Mean ± SEM. * p ≤0.05.

