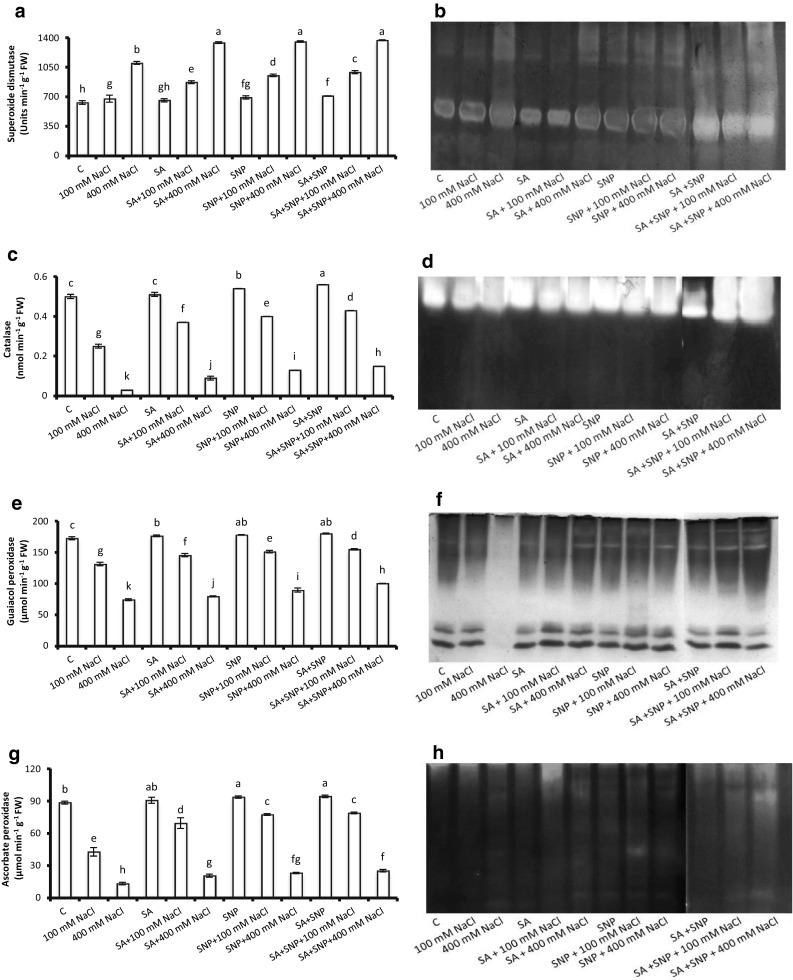
Fig. 4.

Activities and isozymic patterns of superoxide dismutase (a, b), catalase (c, d), guaiacol peroxidase (e, f) and ascorbate peroxidase (g, h) in P. sativum L. radicles exposed to various experimental solutions for 7 days. Bars presented in the graphs are mean ± SE of five separate observations. Different letters indicate significant difference between treatments at P < 0.05
