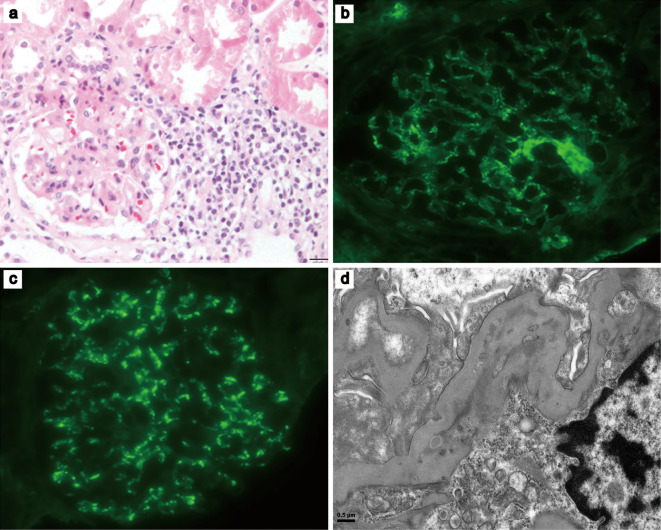
Figure 2.
Renal biopsy. (a) Light microscopy, focal infiltration by small to medium-sized atypical lymphoid cells can be seen in periglomerular and peritubular regions (Hematoxylin and Eosin staining, ×40). (b and c) An immunofluorescence examination showing mesangial deposits of (b) IgA (×40) and (c) C3 (×40). (d) An electron microscopic image (×3,000) showing a small amount of dense deposits in the mesangial matrix. C3: complement component 3, IgA: immunoglobulin A

