
. 2017 Feb 17;8:92. doi: 10.3389/fphys.2017.00092
Copyright © 2017 Argilés, Betancourt, Guàrdia-Olmos, Peró-Cebollero, López-Soriano, Madeddu, Serpe and Busquets.
This is an open-access article distributed under the terms of the Creative Commons Attribution License (CC BY). The use, distribution or reproduction in other forums is permitted, provided the original author(s) or licensor are credited and that the original publication in this journal is cited, in accordance with accepted academic practice. No use, distribution or reproduction is permitted which does not comply with these terms.
Figure 2.
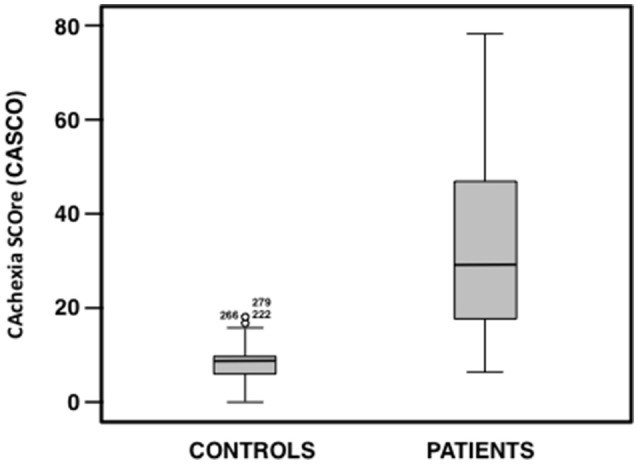
Box plot of CASCO total score for each group (patient and control groups).