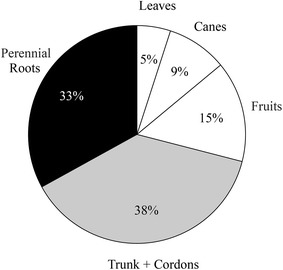
Fig. 3.

Average percentage distribution of fractions of biomass. C (kg plant−1) based on 72 aboveground and 12 belowground samples of 15 year old Cabernet Sauvignon grapevines. White slices represent annual biomass C, and black and grey slices indicate perennial biomass C
