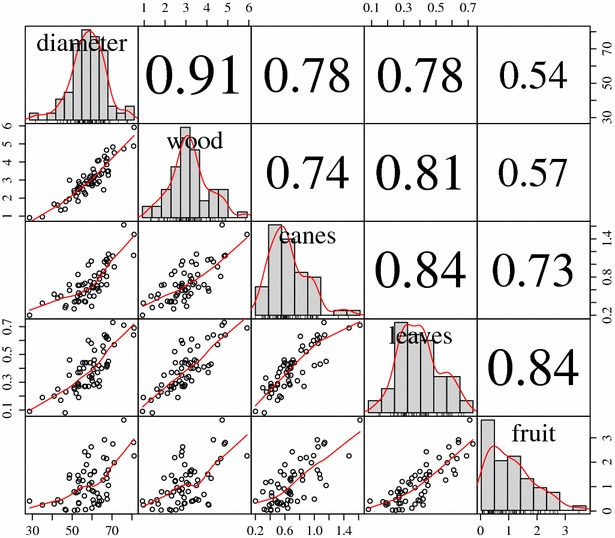
Fig. 5.

Scatterplot matrix showing correlations between vine components. Vine trunk diameter (mm) and vine C stocks (kg C vine−1) fractions in wood (trunk plus cordons, i.e. permanent scaffold), canes, leaves and fruit (grape clusters including rachis) are shown. The lower left triangle below the diagonal shows scatterplots with loess curves (x and y axis indicating values for each variable). The frequency histograms in the diagonal include kernel density estimation curves (only x axis indicating values for the variable). The upper right triangle shows Pearson correlation coefficients with all levels of significance p < 0.001, (n = 60)
