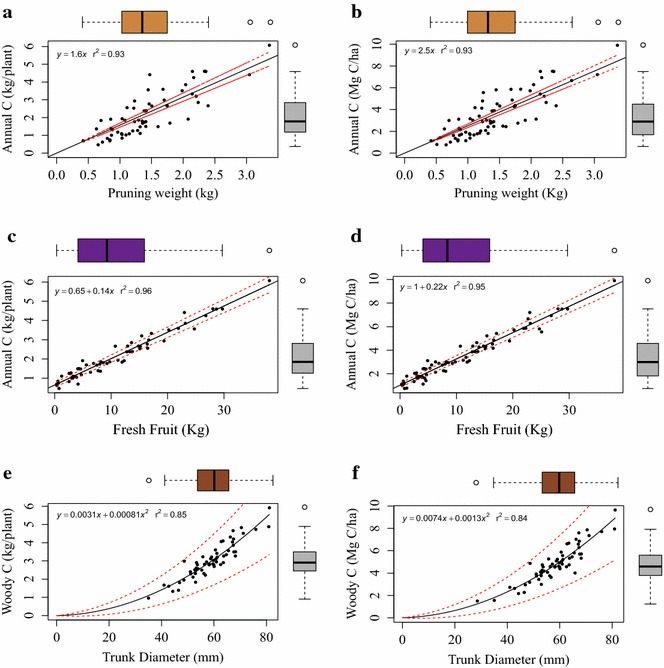
Fig. 6.

Linear and quadratic vine allometrics with 95% confidence intervals. Allometrics for (a) pruning weight and annual C stocks (R 2 = 0.93, p < 0.001), b fresh fruit weight and annual C stocks (R 2 = 0.96, p < 0.001), and c trunk diameter and woody C stocks (R 2 = 0.85, p < 0.001) are shown. Annual C stocks represent the C content of canes, leaves and fruit together. Woody C stocks represent the C content of trunk plus cordons (perennial wood). Allometrics scaled to block level response (Mg C ha−1) at planting density are also shown for pruning weight (d), wet fruit (e), and trunk diameter (f)
