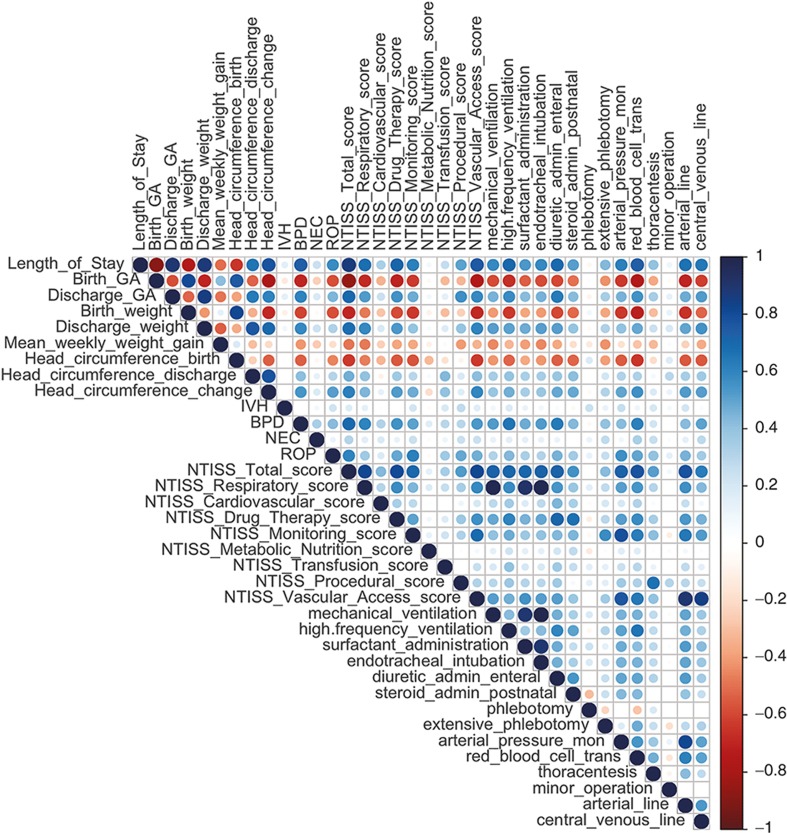
Figure 1.
Correlation matrix of the clinical data and Neonatal Therapeutic Intervention Scoring System scores. In this correlation matrix, positive correlations are presented in blue and negative correlations are presented in red color. Color intensity and the size of the circle are proportional to the correlation coefficients.

