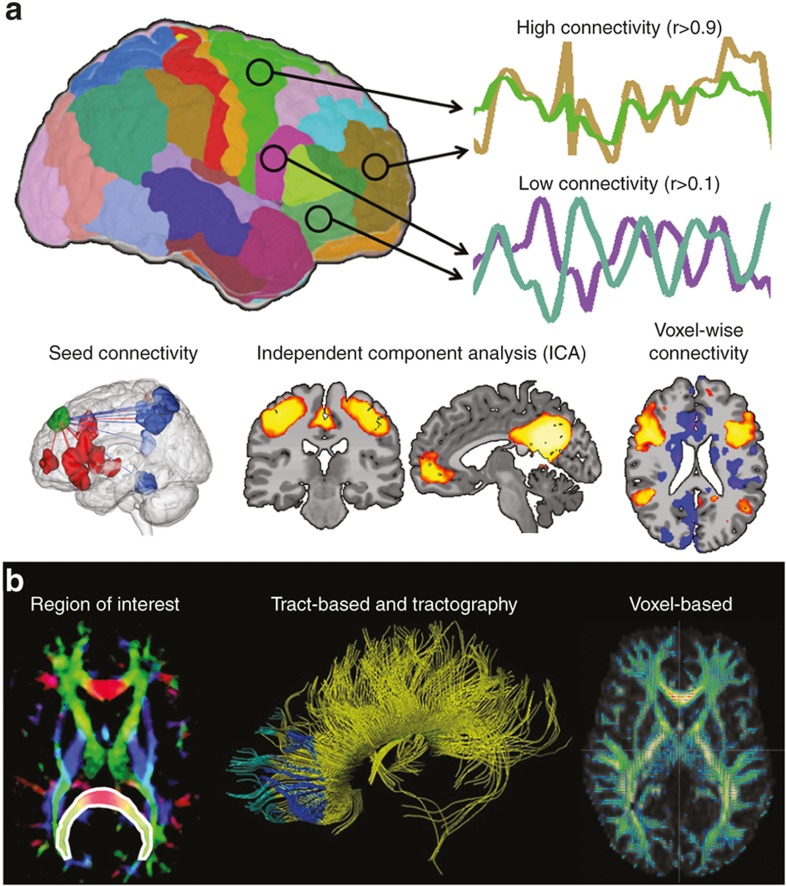
Figure 1.
Examples of functional and structural connectivity. (a) Functional connectivity. Functional connectivity measures the synchrony or correlation of brain activity between two or more regions of the brain. Common methods include seed connectivity, independent components analysis, and voxel-wise connectivity. Seed-based connectivity measures functional connectivity from a predefined region of interest (ROI, or seed, shown in green) and the rest of the gray matter. Regions of positive or negative functional connectivity are shown as red and blue regions. Independent components analysis is mathematical modeling technique that parcellates the brain into independent spatial components or networks. Example components shown are the motor network and the defualt mode network. Voxel-wise connectivity methods involve correlating the time course of every voxel in the gray matter with the time course of every other voxel in the gray matter. Connectivity for each voxel are often summarized to a single number using network theory to highlight so-called hub regions in the brain. (b) Structural connectivity. Structural connectivity measures anatomical white matter connections linking different cortical and sub cortical regions. Common methods include ROI quantification, tract-based and tractography, and voxel-based morphometry. For ROI quantification, average FA across all voxels in a priori ROIs (shown in white outline and overlay) is compared across study groups. Tractography is modeling technique used to identifying white matter tracts used in further analyses. In VBM analysis, FA data from all subjects is transformed into a common space and comparison across each voxel of the white matter is performed. (Figure modified with permission, John Wiley & Sons, Hoboken, NJ)

