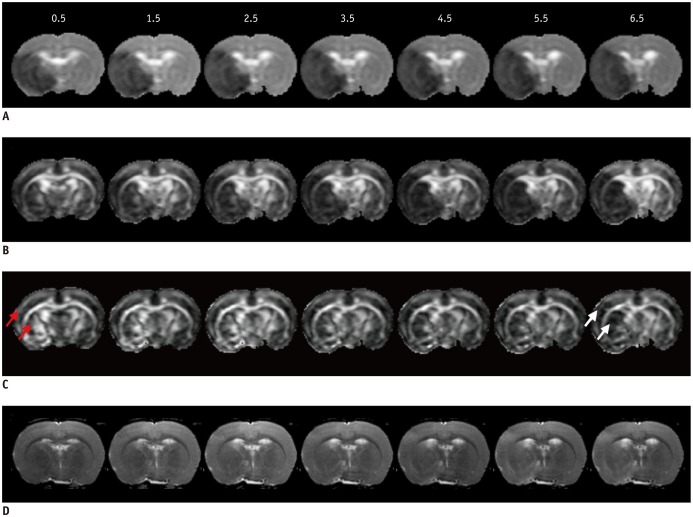
Fig. 1. Serial L (A), q (B), FA (C), and T2WI (D) maps of rat for demonstrating spatiotemporal evolutions.
L and q maps showed significant hypointensities on ischemic lesion, while FA maps displayed initial elevation (red arrows) of ischemia with later reduction (white arrows) by 6.5 hours. T2WI showed progressively minor increased intensity in ischemia areas, over time. FA = fractional anisotropy, T2WI = T2-weighted imaging

