
Fig. 5. Relationship between rq value and time after stroke for cortical IC.
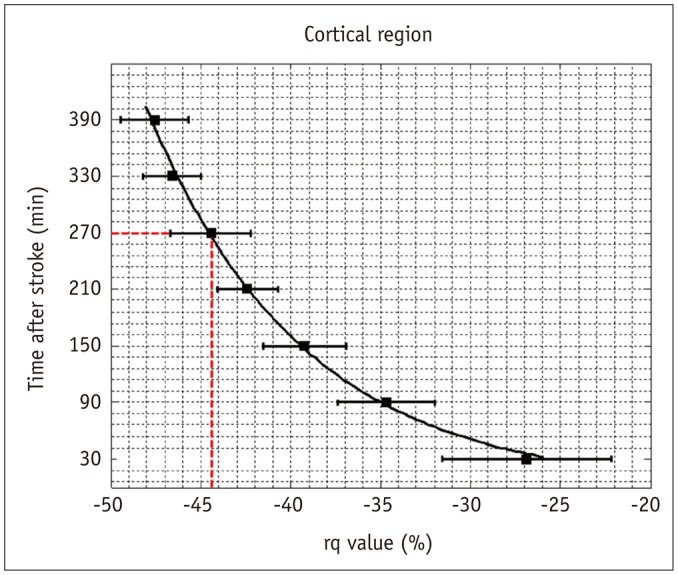
Solid curve represents empirical relationship, i.e., elapsed time = 1.636 x exp (-0.115 × rq value), estimated by nonlinear regression analysis. Red dashed lines indicate that 4.5-hr stroke onset can be identified by 44.6% reduction of rq value. Error bars are ± SEM. IC = infarct core