
Fig. 2. ALFF maps show differences between post-LT patients and HCs (p < 0.05, corrected by AlphaSim).
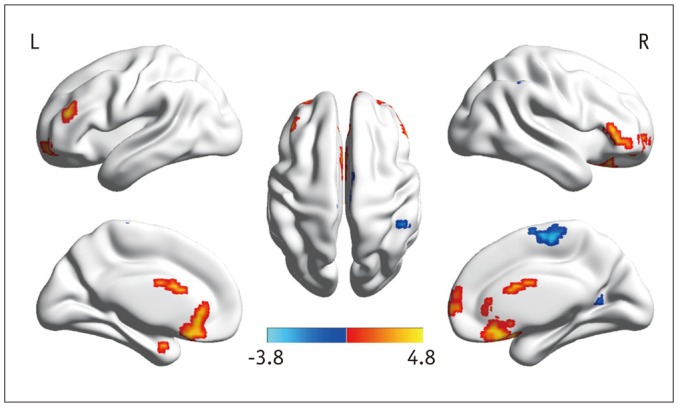
ALFF decreases in right IPL, calcarine, and SMA and increases in right SFG, IFG, left PHG, and MFG are detected in post-LT patients. ALFF = amplitude of low-frequency fluctuation, HCs = healthy controls, IFG = inferior frontal gyrus, IPL = inferior parietal lobule, LT = liver transplantation, MFG = middle frontal gyrus, PHG = parahippocampal gyrus, SFG = superior frontal gyrus, SMA = supplementary motor area