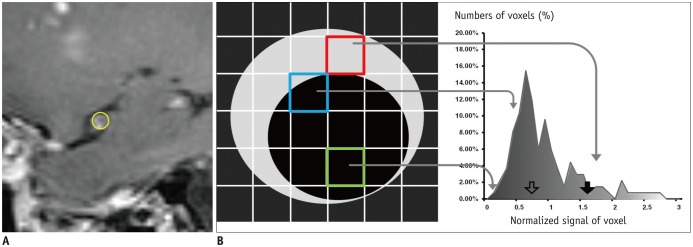
Fig. 1. Example of histogram analysis of MCA wall enhancement.
Case with eccentric enhancement in source image (A) of 3D CE T1-TSE and corresponding region-of-interest (yellow circle in A) for enhancing middle cerebral artery including wall and its lumen. Left side of scheme (B) is scheme of sagittal M1 segment and matching voxel of 3D CE T1-TSE. Enhancing wall with variable degrees of thickness is presented in gray, and lumen of MCA and surrounding tissues are presented in black. Voxel intensity was decided from mean values of internal tissues, and depended on ratio of vessel wall, lumen and surrounding tissues. Voxel has mixed contents of enhancing wall and lumen with variable degrees (blue box). As result, voxels had variable degrees of signals from those of enhancing walls only (red box) to those of lumen only (green box). Example of histogram of normalized signal of VOI is located on right side of scheme. Shaded area under histogram represents relative signal intensities. Two histogram parameters, 90th percentile (solid arrow) and geometric mean (empty arrow) are marked. MCA = middle cerebral artery, VOI = volume of interest, 3D CE T1-TSE = 3-dimensional contrast-enhanced T1-weighted turbo spin echo image

