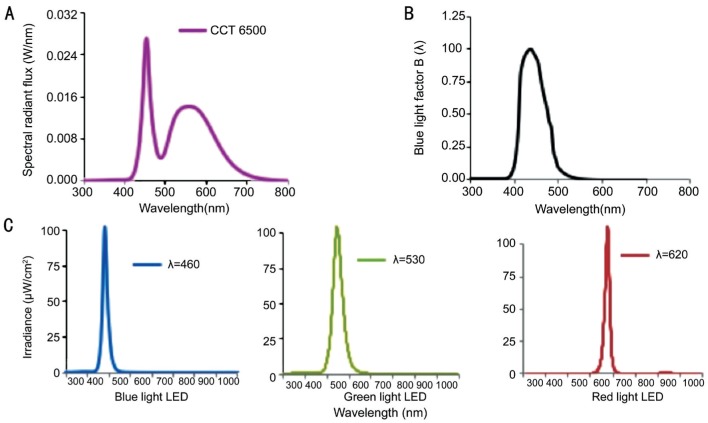
Figure 1. LED light sourcespectral power distribution (SPD) curves.
A: Yellow phosphor-converted white LED to exhibit correlated color temperature (CCT) at 6500 K; the first peak appeared at 460 nm with 0.028 W/nm showing the blue content and the second peak with a bell shape presenting a large portion of yellow content; B: Blue light factor B(λ) distribution; C: Single-wavelength blue light LED peaked at 460 nm with 102.3 µW/cm2 in radiometric units. Green light LED peaked at 530 nm with 102.8 µW/cm2. Red light LED peaked at 620 nm with 102.7 µW/cm2.

