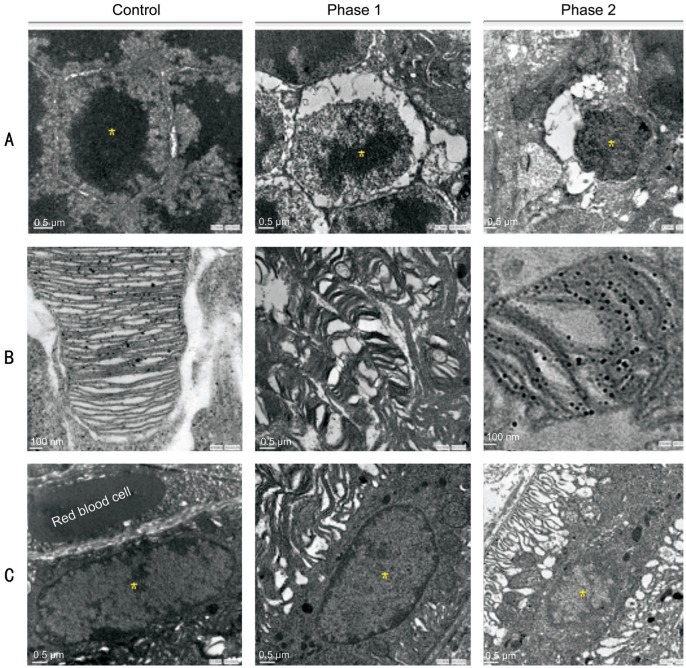
Figure 4. Retinal cellular injury studied by TEM.
A: Normal ONL nucleolus on the left; nucleolus condensation in phase 1 remodeling and pyknosis in phase 2; B: Normal POS on the left; POS deformations in phase 1 remodeling and round POS debris in phase 2; C: Normal RPE nucleus on the left; shrinking RPE nucleus in phase 1 and condensation in phase 2. There are 36 sections analyzed and 244 of pyknotic RPE nuclei observed after the blue light exposure; n=4 for the control group and n=6 for the exposure group. Scale bar=100 nm for the control and phase 2 in B; scale bar=0.5 µm for the rest of other images.

