
Figure 2.
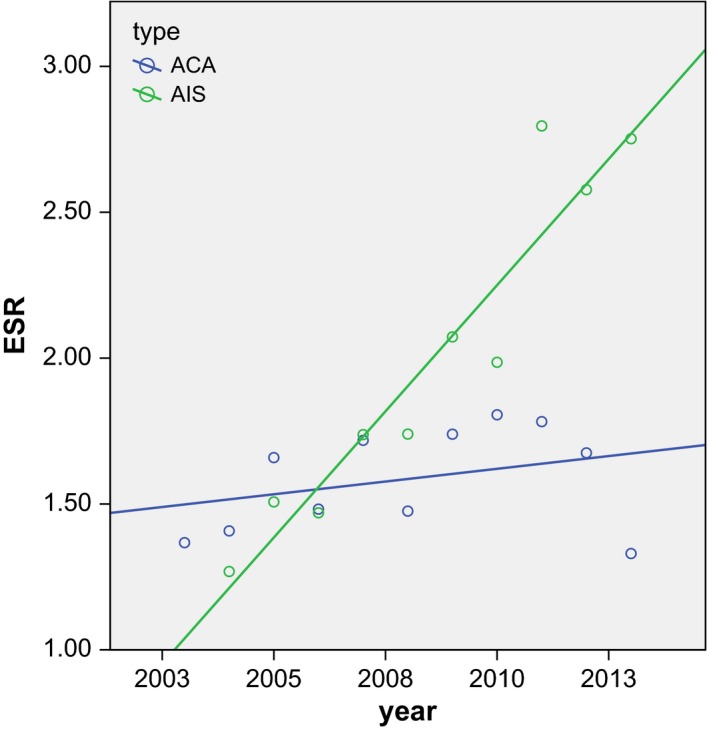
Scatterplot of the European Standardized Rates of AIS in the years 2004–2013 with correlation lines. ACA r = 0.330 with P = 0.322/AIS r = 0.951 with P = 0.000. ACA, adenocarcinoma; AIS, adenocarcinoma in situ.
Official websites use .gov
A
.gov website belongs to an official
government organization in the United States.
Secure .gov websites use HTTPS
A lock (
) or https:// means you've safely
connected to the .gov website. Share sensitive
information only on official, secure websites.
Scatterplot of the European Standardized Rates of AIS in the years 2004–2013 with correlation lines. ACA r = 0.330 with P = 0.322/AIS r = 0.951 with P = 0.000. ACA, adenocarcinoma; AIS, adenocarcinoma in situ.