
Figure 3.
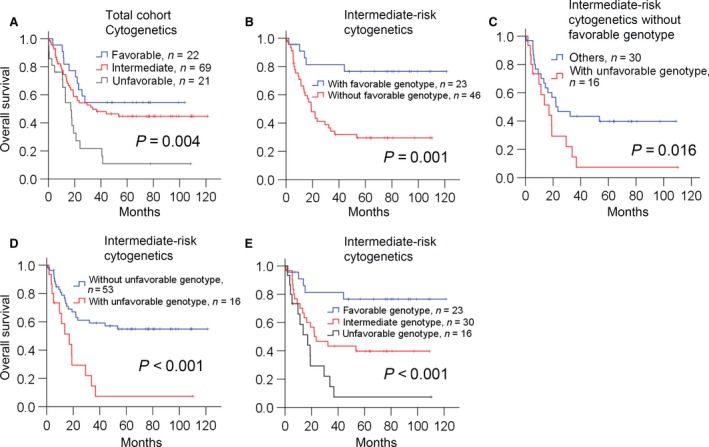
Overall survival estimated by Kaplan–Meier analysis according to (A) cytogenetic risks in the entire cohort. (B) favorable genotype in patients with intermediate‐risk cytogenetics. (C) unfavorable genotype in patients with intermediate‐risk cytogenetics. (D) unfavorable genotype in patients with intermediate‐risk cytogenetics without favorable genotype. (E) revised classification system in patients with intermediate‐risk cytogenetics.