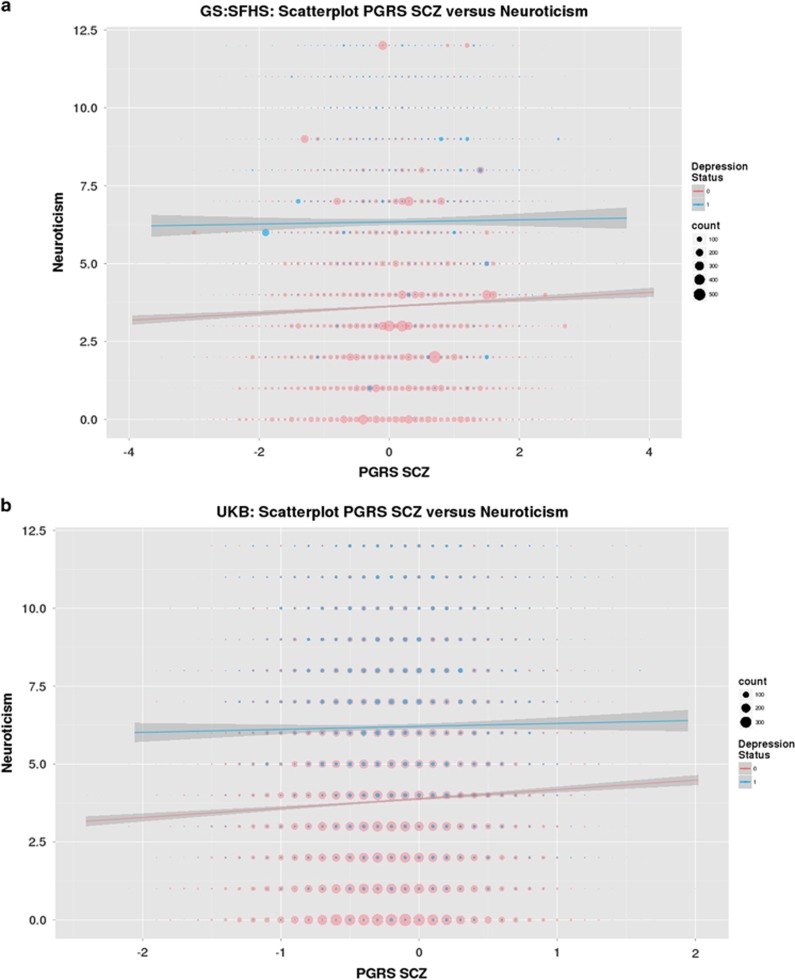
Figure 1.
(a and b) Scatterplot of SCZ PRS and neuroticism according to MDD status in GS:SFHS, and UK Biobank (UKB), respectively. The size of circles represents the degree of overlapping data points. For clarity, histograms of the distribution of neuroticism scores in cases and controls for both cohorts are presented in the Supplementary Figures 1a and b. GS:SFHS, Generation Scotland: Scottish Family Health Study; MDD, major depressive disorder; PRS, polygenic risk score (PGRS in the figure); SCZ, schizophrenia.

