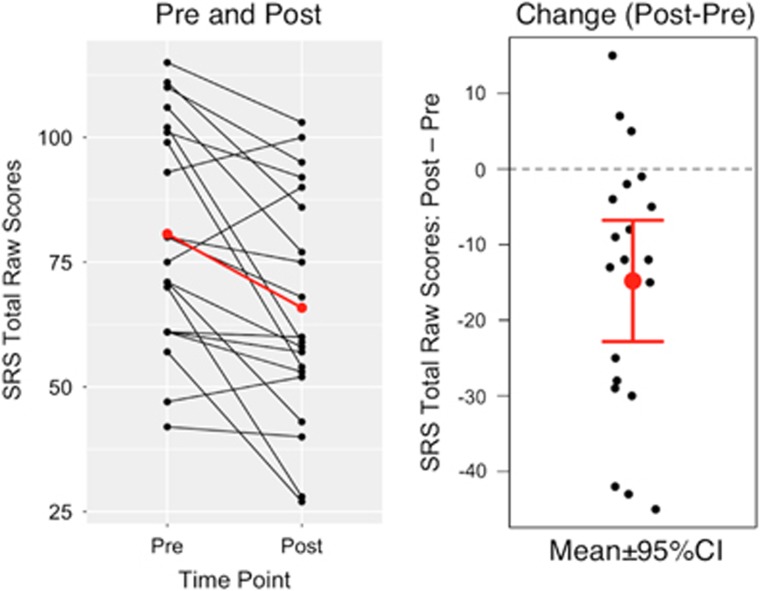
Figure 1.
Treatment effectiveness quantified as the change in SRS total raw score. Left: the black lines indicate each child's change in core autism symptom severity from pretreatment to posttreatment; the red line is the group mean. Right: the mean and the 95% confidence interval (CI) of Δ, the change score (that is, post minus pre). SRS, Social Responsiveness Scale.

