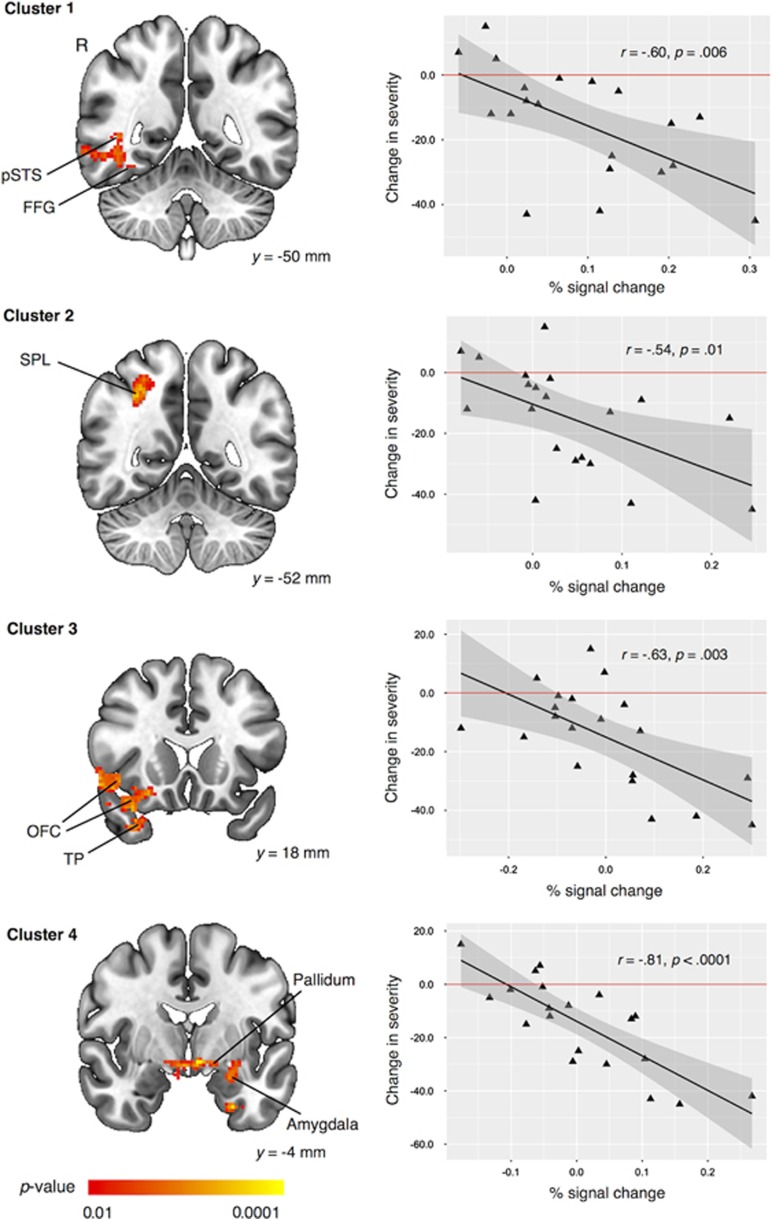
Figure 2.
Prediction of treatment effectiveness using univariate general linear model (GLM). Four distinct brain regions, in which greater pretreatment BOLD activation (% signal change) in the contrast of biological vs scrambled motion was associated with greater treatment effectiveness. Scatterplot illustrating pretreatment BOLD activation and actual change in severity (that is, post minus pre), with a horizontal reference line at y=0 indicating no change from pretreatment to posttreatment (that is, post=pre). BOLD, blood oxygen level dependent; FFG, fusiform gyrus; OFC, orbital frontal cortex; pSTS, posterior superior temporal sulcus; R, right; SPL, superior parietal lobule; TP, temporal pole.

