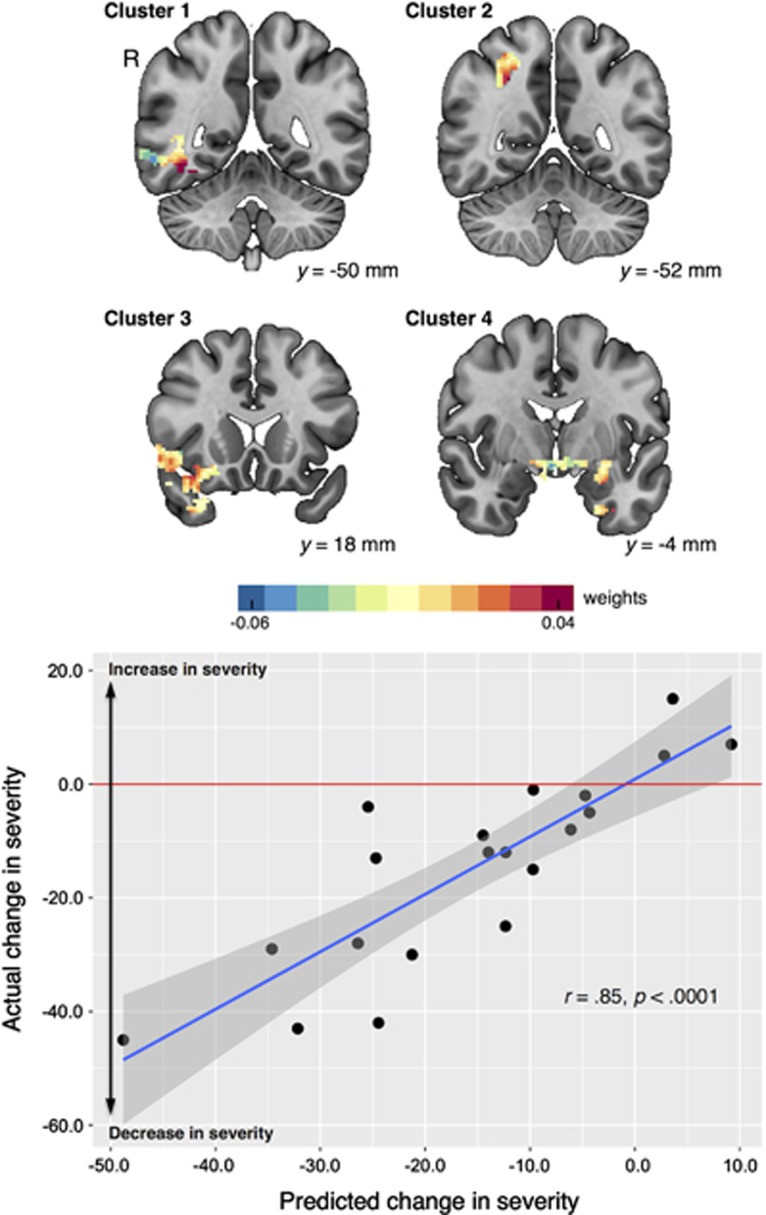
Figure 3.
Predictive accuracy of the univariate neuropredictive clusters, as estimated by MVPA with cross validation. Top: weight map showing the relative weights derived from the multivariate modeling of pretreatment response to biological motion that contributed to the prediction of change in severity (that is, post minus pre) at representative slices (MNI152 mm space). Bottom: scatterplot illustrating actual and predicted treatment effectiveness, with a horizontal reference line at y=0 indicating no change from pretreatment to posttreatment (that is, post=pre). Cross validation was based on a leave-one-subject-out framework. MNI, Montreal Neurological Institute; MVPA, multivariate pattern analysis; R, right.

