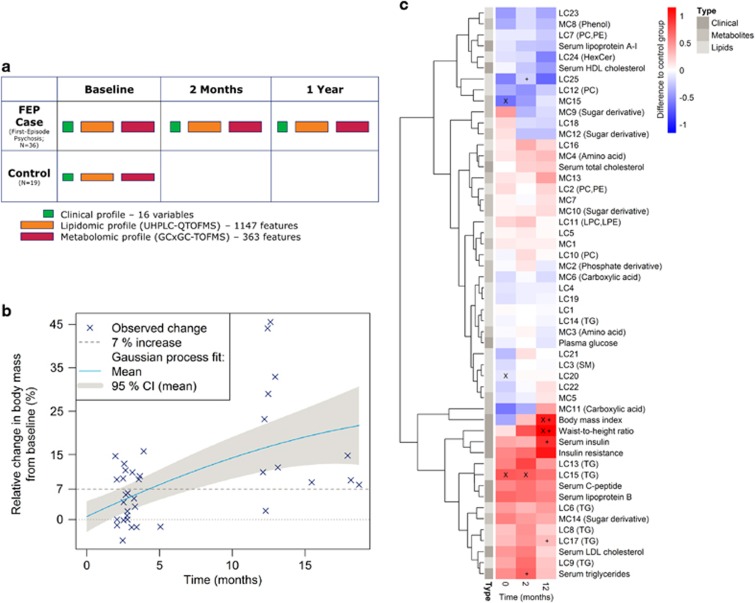
Figure 1.
(a) Schematic representation of the experimental design. (b) Relative weight gain (blue crosses) from baseline as a function of time in the FEP case group. The median increase in body mass was 3 and 11 kg from baseline to the 2-month and 1-year follow-up points, respectively. Nonlinear Gaussian process regression model was fit on the weight gain data to visually highlight the trend. (c) Differences in the medians between the case group in the three time points (columns) and control group for clinical variables, metabolite clusters (MCs) and lipid clusters (LCs). Major differences between the case and control groups are highlighted with a diagonal cross ( × ) and major differences between the follow-up time points and the baseline time point among the case group are highlighted with a straight cross (+). Both the tests are based on a coupled Mann–Whitney U-test and a bootstrap test of difference with simultaneously P<0.05 in both the tests used as a threshold. Statistically significant enrichment (at FDR 0.01) of a functional group in a cluster is shown in parenthesis following the cluster name. FDR, false discovery rate; FEP, first-episode psychosis.

