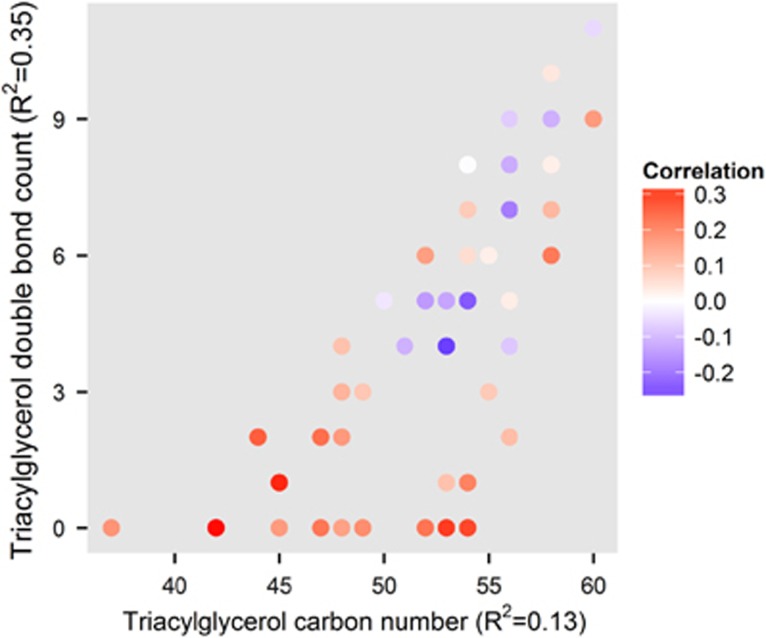
Figure 3.
Association between the level of triacylglycerols (TGs) at baseline and the 2-month follow-up weight gain (Spearman correlation; color of the points) with respect to the number of carbon atoms (x-axis) and the number of double bonds between carbon atoms (y axis). The baseline levels of saturated and monounsaturated compounds (y=0 and y=1, respectively) are associated with short-term weight gain (red color). The coefficient of determination (R2) of the linear model for the association as a function of triacylglycerol carbon number and double-bond count are shown in the x axis and y axis labels, respectively (both P<0.05).

