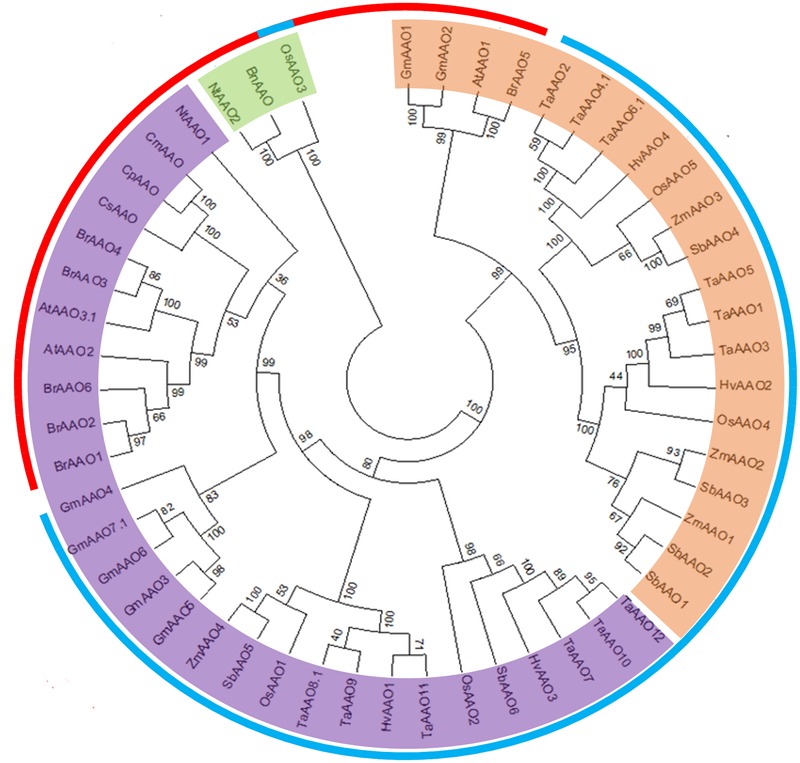
FIGURE 2.

Phylogenetic analysis of AAO from diverse genera. An unrooted parsimonious tree of AAO proteins showing different clades. Clade I is marked in orange color while, clade II and clade III are marked in purple and green color, respectively. The outer circle denotes monocot (blue color) and dicot (red color) plant species taken for phylogenetic study. The tree was plotted using Mega7 software.
