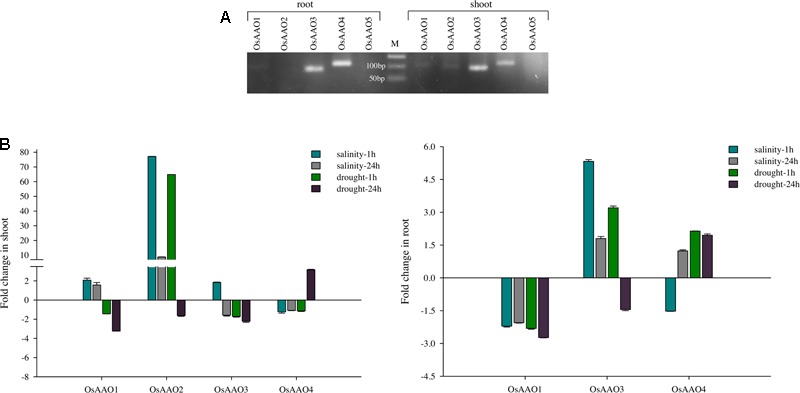
FIGURE 6.

Expression pattern of AAO genes in rice based on RT-PCR and qRT-PCR analysis. (A) EtBr stained agarose gel depicting the expression of AAO genes in root and shoot tissue of rice seedling. Individual lanes show amplicons corresponding to OsAAO1–OsAAO5 amplified from rice root and shoot tissue using gene specific real-time PCR primers. M corresponds to 50 bp ladder. (B) Histogram representing fold change of OsAAO1, OsAAO2, OsAAO3, and OsAAO4 in 1 and 24 h stress treated shoot and root tissue of rice seedling based on qRT-PCR analysis. OsAAO5 could not be amplified hence it was not included in real-time analysis. Real-time PCR was done with cDNA template synthesized from shoot and root tissue of 10 days old control or stressed (salinity 200 mM NaCl and drought) rice seedlings.
