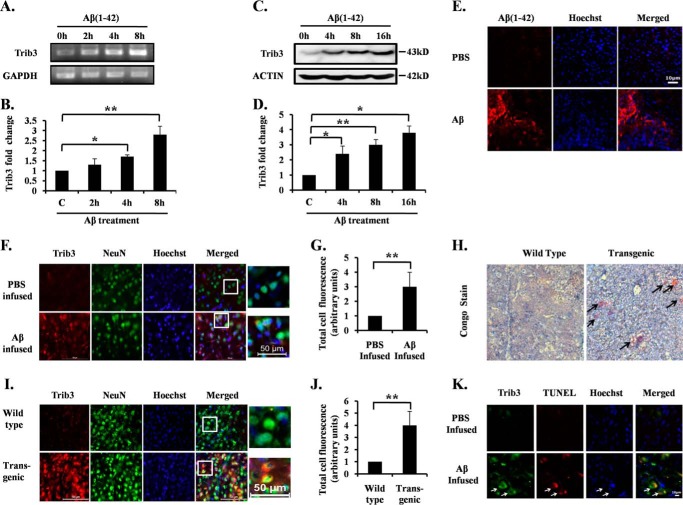
FIGURE 1.
Trib3 mRNA and protein levels are elevated in response to Aβ in vitro and in vivo. Primary rat cortical neurons (7DIV) were treated with oligomeric Aβ 1.5 μm for the indicated times. A, total RNA was isolated, subjected to reverse transcription, and analyzed by semi-quantitative PCR using Trib3 primers. GAPDH was used as loading control. B, graphical representation of fold changes in Trib3 transcript level upon Aβ treatment to rat cortical neurons for the indicated times by quantitative real time PCR. GAPDH was used as loading control. Data represent mean ± S.E. of three independent experiments. *, p < 0.05; **, p < 0.01. C, primary cultured rat cortical neurons were treated with Aβ for the times indicated. Total cell lysates were subjected to Western blotting analysis for Trib3 levels. A representative immunoblot of three independent experiments with similar results is shown. Actin was used as loading control. D, graphical representation of the Trib3 protein levels as quantified by densitometry of Western blottings in cortical neurons subjected to Aβ treatment for different time points. Data are expressed relative to untreated control. Data represents mean ± S.E. of three independent experiments. *, p < 0.05; **, p < 0.01. E, brain sections of the infused rats were immunostained with Aβ(1–42) antibody to check the presence of Aβ plaques in the infused brain area. Upper panel shows immunostaining of Aβ(1–42) antibody from brain sections of rats infused with PBS. Lower panel shows brain section immunostained with Aβ(1–42) antibody of Aβ-infused rat brains. F, adult rat brains were infused with either Aβ or PBS in the right hemispheres. 21 days later, the animals were sacrificed; brains were then cryosectioned, and sections were co-immunostained with antibodies for Trib3 and NeuN. Hoechst dye was used to stain nuclei. A representative image of one of the brain sections with similar results in each case is shown here. Images were taken using an inverted fluorescence microscope. G, graphical representation of corrected total cell fluorescence of Trib3 in PBS-infused and Aβ-infused brain sections. Difference in the intensity of Trib3 staining is quantified by ImageJ as described under “Experimental Procedures.” Data represent mean ± S.E. of 30 different cells from three independent experiments. **, p < 0.001. H, Congo red staining of brain slices from transgenic and wild-type mice. Transgenic mouse brain shows the presence of amyloid plaques (shown by arrow), whereas such plaques were absent in the wild-type brain tissue. Representative images of six sections from three animals of each group with similar results are shown here. Images were taken under ×5 objective. I, level of Trib3 expression was analyzed in brain sections obtained from AβPPswe-PS1de9 transgenic mice and control littermates. Brain sections from transgenic and control mice were co-immunostained with Trib3 and NeuN antibodies. Nuclei were stained with Hoechst. Representative image of one of the brain sections with similar results in each case is shown here. J, graphical representation of corrected total cell fluorescence of Trib3 in transgenic and wild-type brain sections. Difference in intensity of Trib3 staining is quantified by ImageJ as described under “Experimental Procedures.” Data represent mean ± S.E. of 30 different cells from three independent experiments. **, p < 0.001. K, brain sections from Aβ and PBS infused rats were analyzed for TUNEL assay and then immunostained for Trib3. Nuclei were stained with Hoechst. Representative images of one of the brain sections with similar results in each case is shown.

