FIGURE 6.
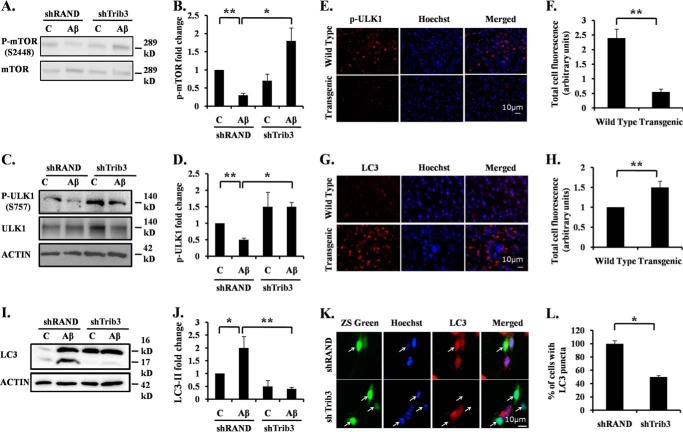
Trib3 leads to increased autophagy in neuronal cells upon Aβ exposure. A, differentiated PC12 cells were transfected with shTrib3 or shRand, primed, and then treated with 5 μm Aβ. Phosphorylation status of mTOR at Ser-2448 was analyzed by Western blotting of cell lysate using p-mTOR antibody, total level of mTOR was also checked. Lane C, control. B, graphical representation of fold change of p-mTOR level by densitometric analysis upon transfection with shTrib3 or shRand in presence or absence of 5 μm Aβ. Data represent mean ± S.E. of three independent experiments. *, p < 0.05; **, p < .001. C, PC12 cells were transfected with shTrib3 or shRand, primed, and then treated with 5 μm Aβ. Phosphorylation status of Ulk1 was analyzed by Western blotting using P-Ulk1 antibody; total level of Ulk1 was also checked. D, graphical representation of fold change of P-Ulk1 level by densitometric analysis upon transfection with shTrib3 or shRand in presence or absence of 5 μm Aβ. Data represent mean ± S.E. of three independent experiments. *, p < 0.05; **, p < .001. E, brain sections obtained from AβPPswe-PS1de9 transgenic mice and control littermates were stained with p-ULK1 (Ser-757) antibody. Nuclei were stained with Hoechst. Representative image of one of the brain sections with similar results in each case is shown. Lane C, control. F, graphical representation of corrected total cell fluorescence of pUlk1 in transgenic and wild-type brain sections. Difference in intensity of pUlk1 staining is quantified by ImageJ as described under “Experimental Procedures.” Data represent mean ± S.E. of 30 different cells from three independent experiments. **, p < 0.001. G, brain sections obtained from AβPPswe-PS1de9 transgenic mice and control littermates were stained with LC3 antibody. Nuclei were stained with Hoechst. Representative image of one of the brain sections with similar results in each case is shown. H, graphical representation of corrected total cell fluorescence of LC3 in transgenic and wild-type brain sections. Difference in intensity of LC3 staining is quantified by ImageJ as described under “Experimental Procedures.” Data represent mean ± S.E. of 30 different cells from three independent experiments. **, p < 0.001. I, PC12 cells were transfected with shTrib3 or shRand, and cells were primed and treated with 5 μm Aβ for 24 h. Cleaved levels of LC3 were analyzed by Western blotting using LC3 antibody. J, graphical representation of fold change of LC3-II levels by densitometric analysis upon transfection with shTrib3 or shRand in presence or absence of 5 μm Aβ. Data represent mean ± S.E. of three independent experiments. *, p < 0.05; **, p < .001. K, cultured cortical neurons (5DIV) were transfected with shTrib3 and shRand; the cells were maintained for the next 48 h and then treated with 1.5 μm Aβ for 16 h, after which they were immunostained with LC3 antibody (red). L, graphical representation of percentage of cells expressing LC3 puncta. Data represent mean ± S.E. of 30 different cells from three independent experiments. *, p < 0.05.

