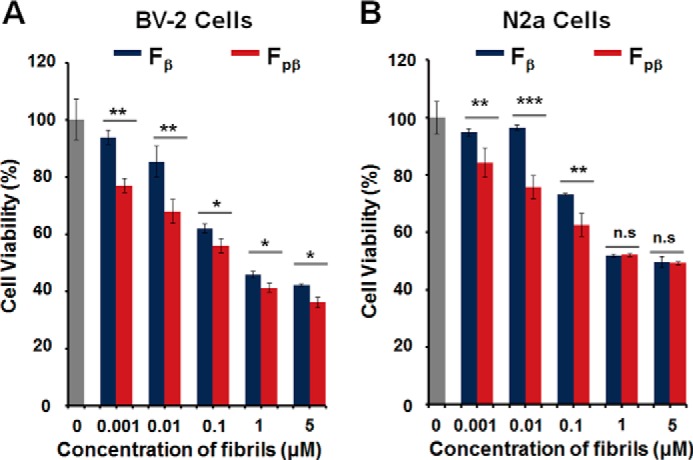
FIGURE 7.

Cytotoxicity of Fpβ and Fβ fibrils were measured using MTT assay. Cell viability of BV-2 cells (A) and N2a cells (B) treated with Fβ and Fpβ fibrils, respectively, for 24 h was measured using an MTT assay. The blank control is shown in gray columns. Fpβ fibrils shows higher toxicity compared with Fβ fibrils in a concentration-dependent manner. n.s., not significant. S.E. is shown as error bars (n = 3 independent measurements; *, p < 0.05; **, p < 0.01; ***, p < 0.001 as evaluated with independent Student's t test).
