FIGURE 8.

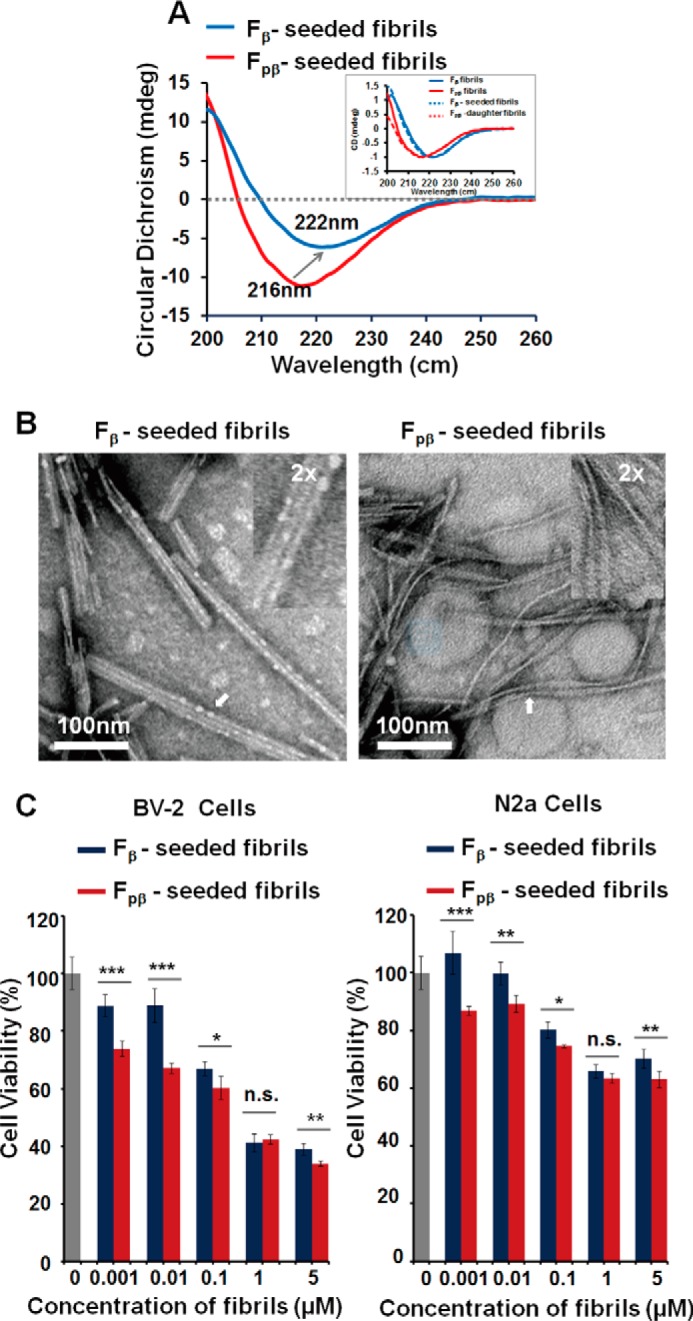
CD spectroscopy, TEM images, and MTT assay indicated that structural features of Fpβ and Fβ fibrils could be propagated to their daughter fibrils. 40 μm Aβ40 was used to examine the structural natures after seeding. A, CD spectroscopy showed that the minimum peak of Fpβ- and Fβ-seeded fibrils was the same as their parent fibrils, respectively. The inset is normalized CD spectroscopy curves of parent and daughter fibrils. B, TEM images of Fpβ- and Fβ-seeded fibrils were identical to their parent fibrils. The samples were prepared after 48-h incubation. C, MTT assay showed that Fpβ-seeded fibrils had higher cytotoxicity of which the trend was the same as for their parental fibrils. S.E. is shown as error bars (n = 3 independent measurements; *, p < 0.05; **, p < 0.01; ***, p < 0.001; n.s., not significant; as evaluated with independent Student's t test). mdeg, millidegrees.
