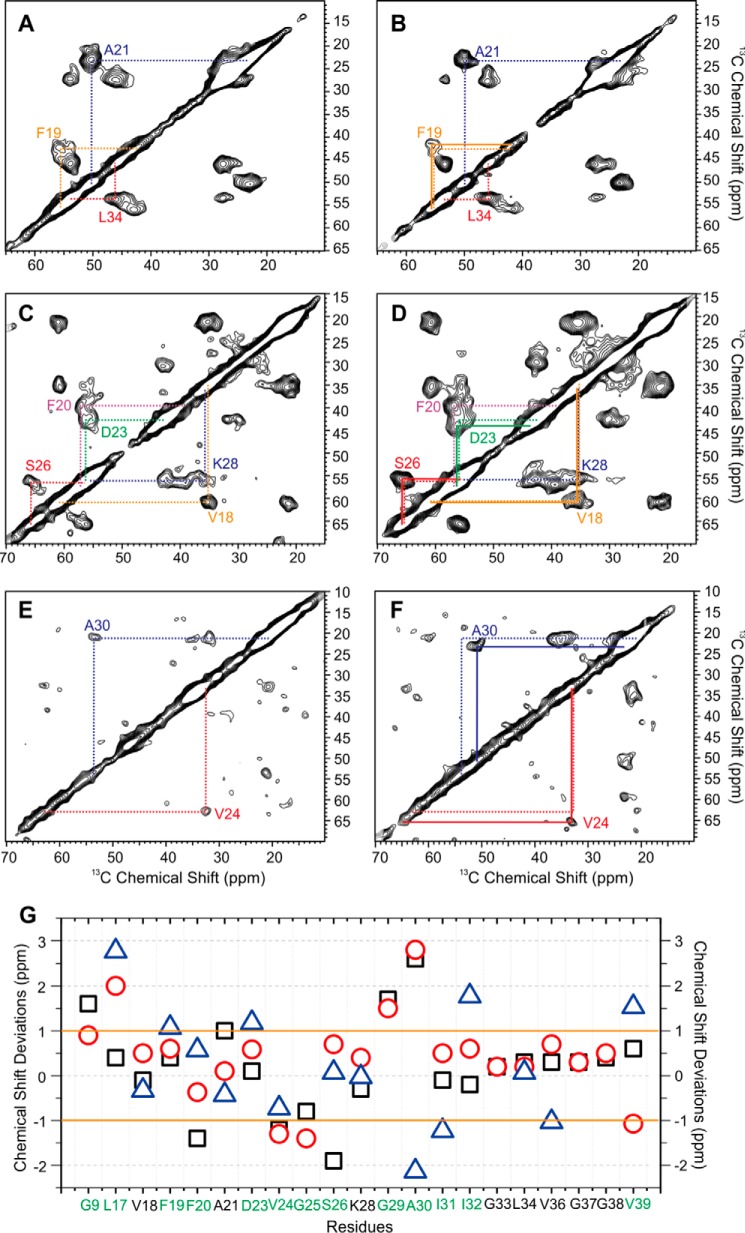
FIGURE 9.
MAS NMR spectra and chemical shift deviations of Fβ- and Fpβ-seeded 40-residue Aβ fibrils. The Fpβ-seeded fibrils (A, C, and E) and Fβ-seeded fibrils (B, D, and F) were isotope-labeled at different residues. Intraresidual Cα-Cβ cross-peaks are highlighted in colored lines. The differences between dashed and solid lines in B, D, and F indicate shifts in cross-peaks. G shows the residue-specific chemical shift deviations (δ(Fpβ-seeded) − δ(Fβ-seeded)) for C′ (black squares), Cα (red circles), and Cβ (blue triangles). The solid orange lines highlight the ±1.0-ppm threshold for significant chemical shift deviation based on the estimation of 13C NMR line widths. Residues with at least one significant chemical shift deviation among C′, Cα, and Cβ are highlighted in green on the x axis.

