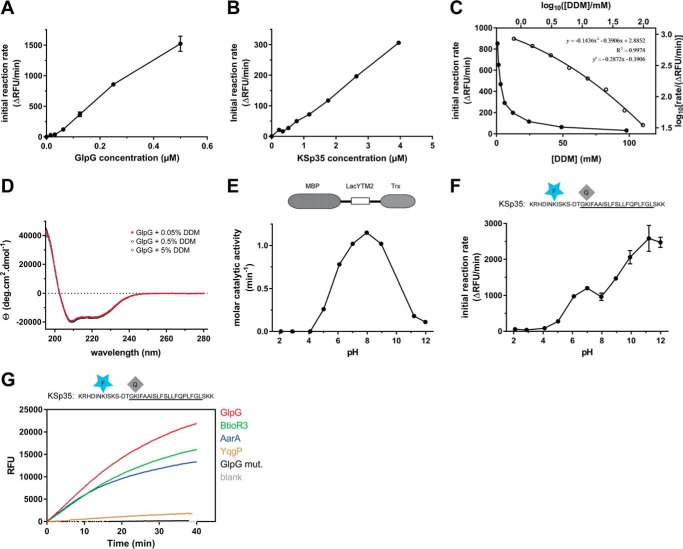
FIGURE 3.
Kinetic characterization of fluorogenic transmembrane peptide substrate KSp35 in the detergent micelle system. A, dependence of the initial reaction rate on enzyme concentration. The fluorogenic substrate KSp35 (10 μm) was incubated with varying concentrations of GlpG in a reaction buffer composed of 20 mm HEPES, pH 7.4, 150 mm NaCl, 0.05% (w/v) DDM, and 10% (v/v) DMSO, and initial reaction rates were measured by following fluorescence at 493 nm. The displayed values are means from duplicate measurements with 2 × S.D. B, dependence of the initial reaction rate on substrate concentration. The rhomboid protease GlpG (0.4 μm) was incubated with varying concentrations of the fluorogenic substrate KSp35 in a reaction buffer composed of 20 mm HEPES, pH 7.4, 150 mm NaCl, 0.05% (w/v) DDM, 10% (v/v) DMSO, and the initial reaction rates were measured by following fluorescence at 493 nm. Representative values from one of three independent experiments are shown. C, dependence of the initial reaction rate on detergent concentration (solid circles, left and lower axes). The fluorogenic substrate KSp35 (10 μm) was incubated with 0.4 μm GlpG at varying concentrations of DDM in a reaction buffer composed of 20 mm HEPES, pH 7.4, 150 mm NaCl, 10% (v/v) DMSO, and initial reaction rates were measured by following fluorescence at 493 nm. Representative values from one of three independent experiments are shown. The open circles (right and upper axes) represent the same plot at the logarithmic scale. When this plot is fitted by second-order polynomial, the equation y = −0.1436x2 − 0.3906x + 2.8852 is obtained, the derivative of which, y′ = −0.2872x − 0.3906, is equal to the power of DDM concentration with which the reaction rate decreases. For high DDM concentrations the derivative tends to −1 (for x = 2, y′ = −0.965), whereas for lower DDM concentrations the absolute value of the power decreases (for x = 0, y′ = −0.3906). D, overall secondary structure of GlpG is not affected by high concentrations of DDM. CD spectra of GlpG at 0.05, 0.5, and 5% (w/v) (98 mm) DDM were recorded and show no variation in the secondary structure content of GlpG depending on DDM concentration. E, the pH dependence of GlpG activity on the LacYTM2-derived chimeric substrate MBP-LacYTM2-Trx. The substrate (2 μm) was incubated with 0.1 μm GlpG in a broad pH range buffer (38) composed of 40 mm H3PO4, 40 mm CH3COOH, and 40 mm H3BO3 adjusted to pH values between 2 and 12, and initial reaction rates were measured by SDS-PAGE and densitometry as described under “Experimental Procedures.” F, the pH dependence of cleavage of the fluorogenic LacYTM2-derived substrate KSp35 by GlpG. The substrate (10 μm) was incubated with 0.4 μm GlpG in a broad pH range buffer (38) composed of 40 mm H3PO4, 40 mm CH3COOH, and 40 mm H3BO3 adjusted to pH values between 2 and 12, and initial reaction rates were measured by recording fluorescence at 493 nm. G, selectivity of the fluorogenic substrate KSp35 for diverse bacterial rhomboid proteases. The purified recombinant rhomboid proteases GlpG, AarA, YqgP (all at 0.4 μm), and BtioR3 (at 0.04 μm) were incubated with 10 μm KSp35 in a reaction buffer composed of 20 mm HEPES, pH 7.4, 150 mm NaCl, 0.05% (w/v) DDM, and 10% (v/v) DMSO, and progress curves were measured by recording the increase in fluorescence at 493 nm.

