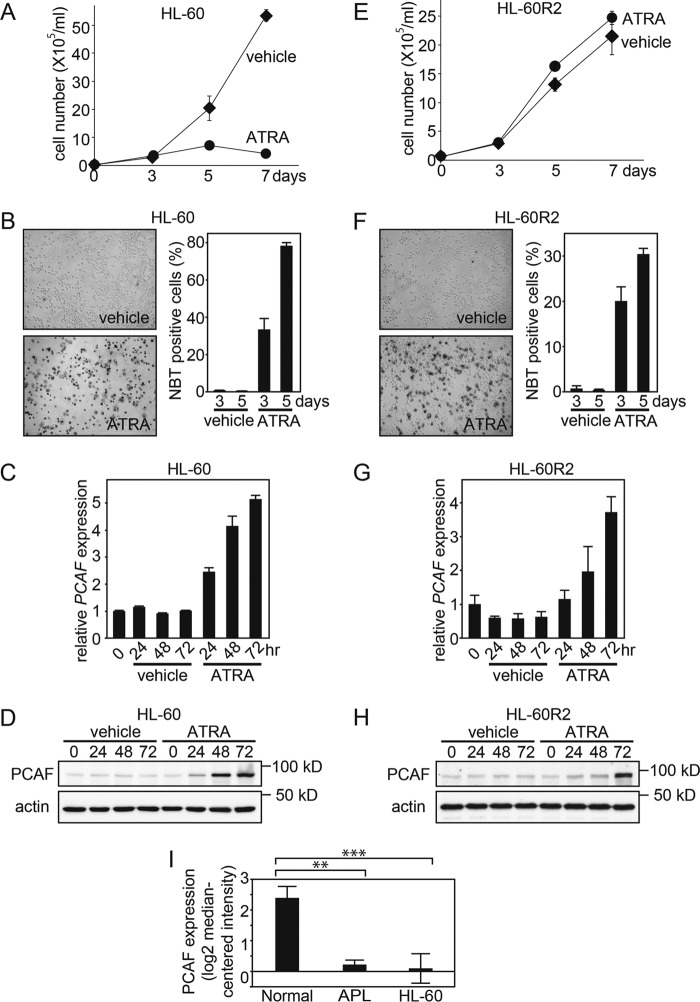
FIGURE 2.
ATRA-induced PCAF expression is associated with granulocytic differentiation. A and E, live ATRA-treated AML HL-60 cells and ATRA-resistant subline HL-60-R2 cells were counted as described in Fig. 1, E and F. The data are shown as the mean ± S.E. (error bars) (n = 3). B and F, the NBT reduction capacities of ATRA-treated HL-60 and HL-60-R2 cells were also examined. The captured images represent HL-60 and HL-60-R2 cells 5 days after the ATRA (1 μm) or ethanol (vehicle) treatment (left). The graphs depict the percentage of NBT-positive cells 3 and 5 days after treatment (right). Counting was performed as described in Fig. 1, G and H. Error bars, mean ± S.E. (n = 3). PCAF expression in HL-60 (C and D) and HL-60-R2 cells (G and H) after the ATRA (1 μm) or ethanol (vehicle) treatment for the indicated period was examined by RT-qPCR (C and G) and immunoblotting (D and H). GAPDH and β-actin were used as the controls for RT-qPCR and immunoblotting, respectively. The RT-qPCR results were quantified as described in the legend to Fig. 1. For the immunoblotting, 50-μg extracts from HL-60 and HL-60-R2 cells were loaded onto each lane. I, PCAF mRNA levels in the normal granulocytes, APL primary cells, and HL-60 cells were determined using the Oncomine microarray database. The PCAF mRNA level was elevated in the normal granulocytes compared with APL primary and HL-60 cells. The data are shown as the mean ± S.E. (normal granulocytes, n = 3; APL cells, n = 2; HL-60 cells, n = 6). **, p < 0.01; ***, p < 0.001.

