FIGURE 5.
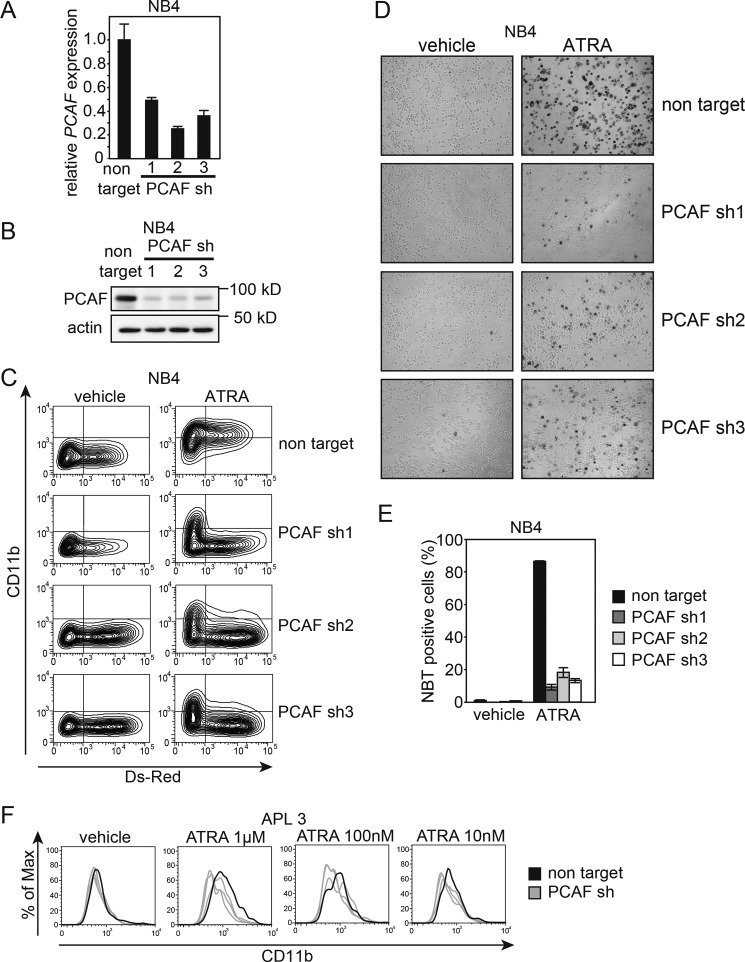
PCAF knockdown inhibits ATRA-induced granulocytic differentiation in NB4 cells and primary APL cells. A and B, cells expressing DsRed were sorted, and knockdown efficiency was then analyzed by RT-qPCR (A) and immunoblotting (B) for PCAF; GAPDH and β-actin were used as the controls for RT-qPCR and immunoblotting, respectively. Three independent sequences of shRNAs were used against PCAF. The RT-qPCR results were quantified by the comparative Ct method. Non-target control values were set as 1, and relative -fold values are depicted in the graph. Experiments were performed in triplicate, and the data are shown as the mean ± S.D. (error bars). For the immunoblotting, 10-μg extracts were loaded onto each lane. C, PCAF knockdown NB4 cells and control cells expressing non-targeting shRNA were cultured with 10 nm ATRA or ethanol (vehicle) for 72 h. DsRed and the expression of the granulocyte marker CD11b were monitored by FACS. FITC-conjugated IgG was used as the control. Infection efficiency was ∼30–60%, based on the proportion of cells expressing DsRed. D and E, the NBT reduction capacities of PCAF knockdown NB4 cells and control cells expressing non-targeting shRNA were also examined. The images were captured 72 h after treatment (D). Cells with NBT reduction capacity were counted and are depicted in the graph (E). Counting was performed as described in the legend to Fig. 1. F, a loss-of-function analysis using a lentiviral vector expressing shRNA against PCAF (gray lines) and non-targeting shRNA (black line) was performed using primary APL blast cells (patient 3). PCAF knockdown APL cells and control cells were cultured with different concentrations of ATRA (1 μm, 100 nm, and 10 nm) or ethanol (vehicle) for 96 h. DsRed and the expression of the granulocyte marker CD11b were monitored by FACS, and experiments were performed as described in the legend to Fig. 5C. Infection efficiency was ∼2–10%, based on the proportion of cells expressing DsRed.

