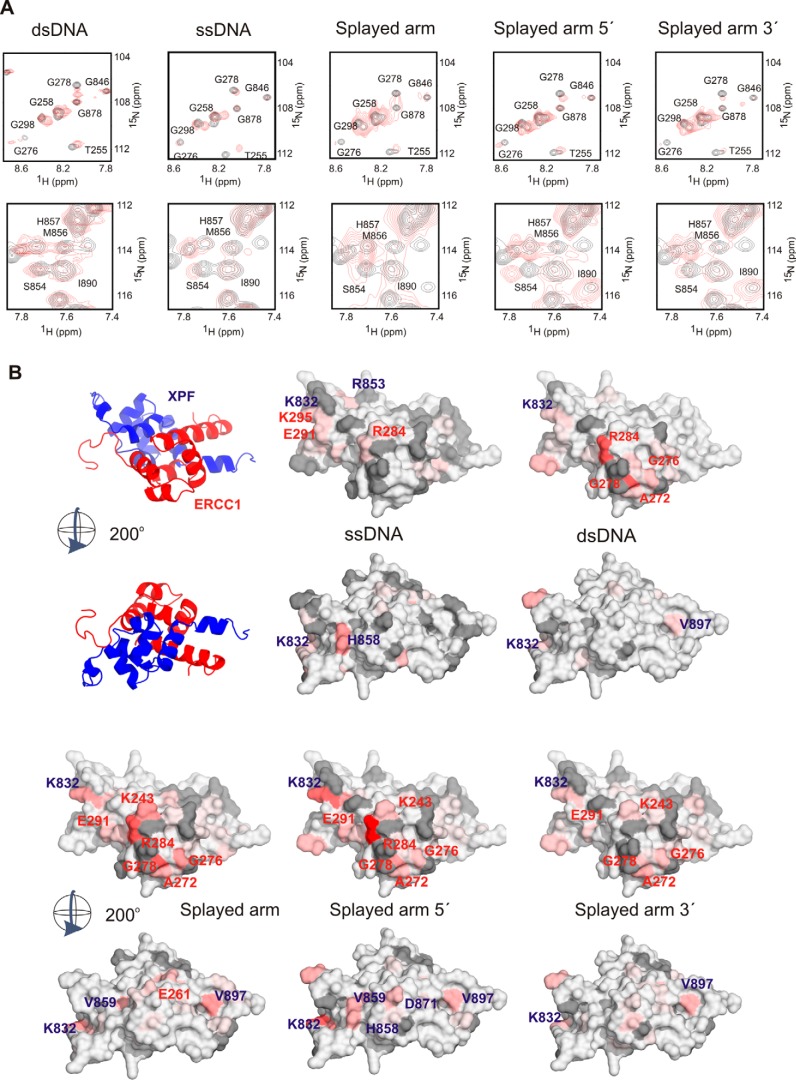
FIGURE 4.
Separate DNA-binding surfaces in ERCC1 and XPF for dsDNA and ssDNA, respectively. A, representative 15N-1H HSQC spectra of affected residues of the ERCC1-XPF complex showing distinct chemical shift changes upon addition of various DNA sequences (supplemental Table S1). Free ERCC1-XPF spectra are shown in black, and spectra in the presence of a 4-fold excess of DNA are shown in red. For this experiment, the indicated DNA fragments (320 μm) were added to 80 μm ERCC1-XPF in a buffer containing 5 mm phosphate buffer and 100 mm NaCl. B, the determined mean CSP ± S.D. of three to five independent titration experiments (supplemental Fig. S3) is plotted on the surface of the ERCC1-XPF structure in two different views rotated by 200°. All residues (∼25) that were significantly affected (composite average chemical shift >0.2 ppm) were colored. The most affected residues are shown in red (>0.8 ppm), and the other residues are colored relatively to this maximum chemical shift in red shades. Missing or unambiguous residues are depicted in gray. The position of the most affected residues is labeled on the surface.

