
FIGURE 5.
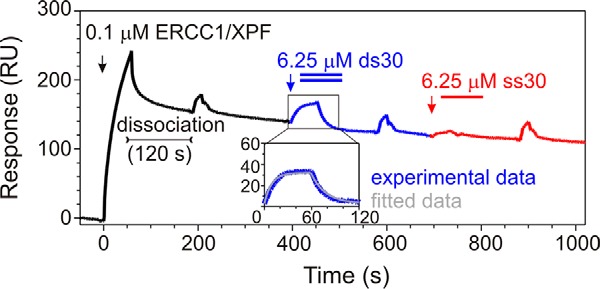
Substrate preference of ERCC1 for dsDNA established by SPR. Shown is the experimental curve (response units(RU)) of subsequential loading (black arrow) of 0.1 μm ERCC1-XPF complex to the Ni2+-loaded NTA SPR chip, followed by XPF dissociation, loading (blue arrow), and dissociation of ds30 probe and (red arrow) loading of the ss30 probe. From the ds30 experimental curve, the ds30 nonspecific binding to the chip surface was subtracted, fitted according to the Langmuir 1:1 binding model, and shown as an inset.