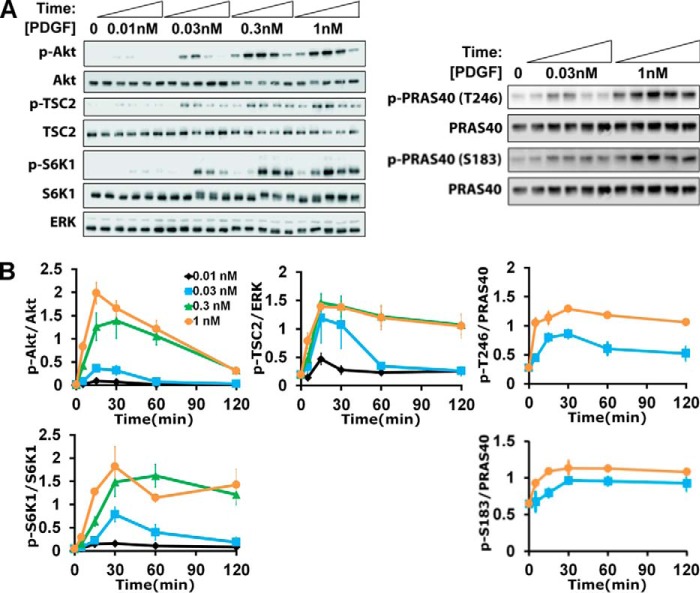
FIGURE 2.
Dynamics of growth factor-stimulated Akt/mTORC1 signaling. A and B, representative immunoblots (A) and quantification (B) of Akt, TSC2, PRAS40, and S6K1 phosphorylation (p) as a function of time and PDGF-BB dose as indicated. The data are normalized by loading controls and then by the mean value of the 1 nm time course for each phospho-protein. The normalized data are reported as mean ± S.E. (n = 5 independent experiments).

