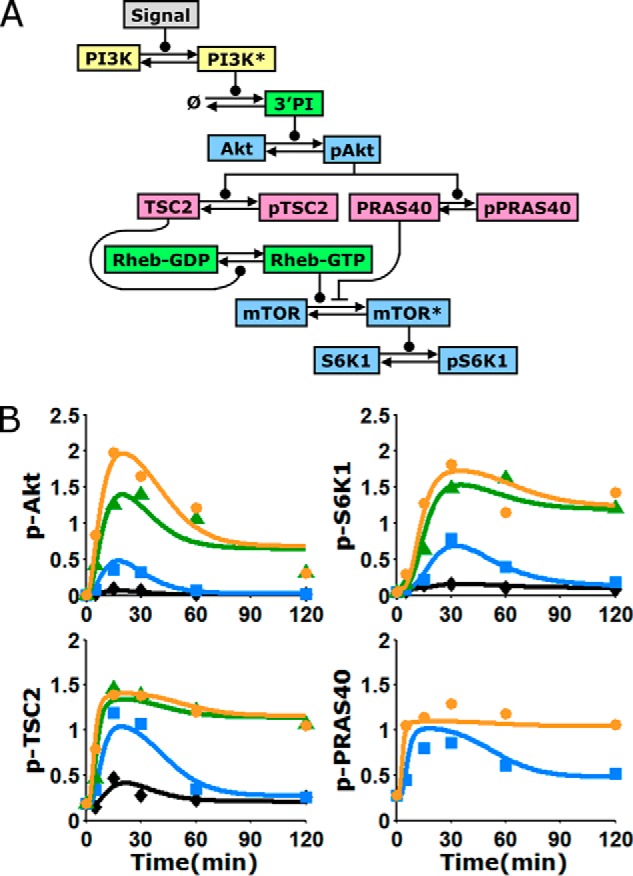
FIGURE 3.

Kinetic model of the Akt/mTORC1 signaling axis, trained on quantitative data. A, schematic of the kinetic model, composed of ordinary differential equations in time. Arrows indicate transformations; connectors ending in circles and bars signify positive and negative regulation of the transformation, respectively. Asterisks signify active kinases; PI, phosphoinositides. B, alignment of the model to the data means presented in Fig. 2B (symbols). The curves represent the mean of the fit to the data, averaging over a large ensemble of parameter sets (n = 10,000; see supplemental Fig. S1 for more detail). See legend in Fig. 2 for explanations of colors and symbols.
