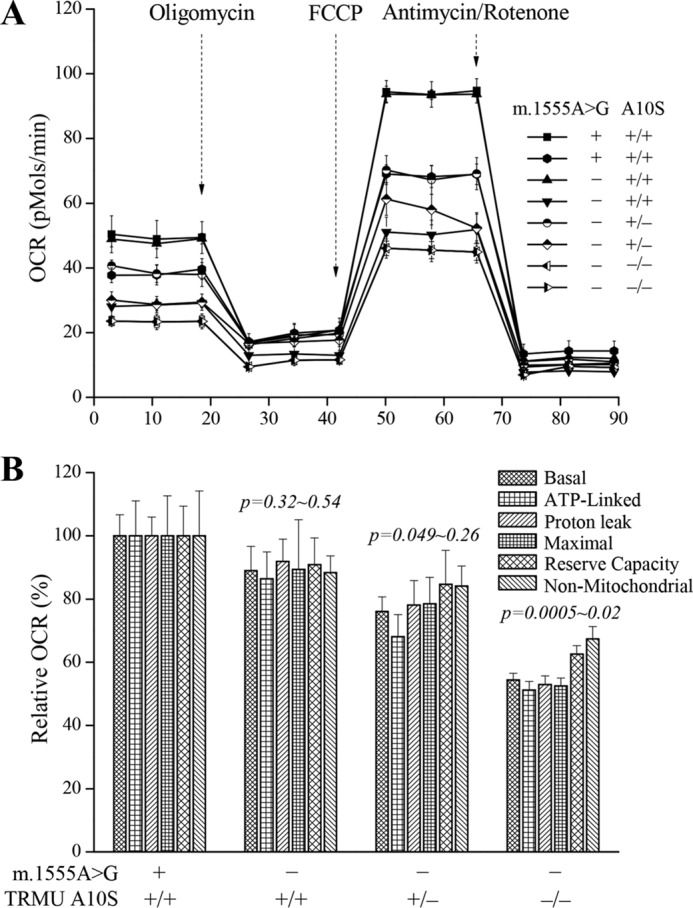
FIGURE 7.

Respiration assays. A, an analysis of O2 consumption in the various cell lines using different inhibitors. The OCRs were first measured on 5 × 10⁴ cells of each cell line under basal condition and then sequentially added to oligomycin (1.5 μm), carbonyl cyanide p-(trifluoromethoxy) phenylhydrazone (FCCP) (0.8 μm), rotenone (1 μm), and antimycin A (5 μm) at indicated times to determine different parameters of mitochondrial functions. B, graphs presented the ATP-linked OCR, proton leak OCR, maximal OCR, reserve capacity, and non-mitochondrial OCR in mutant and control cell lines. Non-mitochondrial OCR was determined as the OCR after rotenone/antimycin A treatment. Basal OCR was determined as OCR before oligomycin minus OCR after rotenone/antimycin. ATP-linked OCR was determined as OCR before oligomycin minus OCR after oligomycin. Proton leak was determined as basal OCR minus ATP-linked OCR. Maximal OCR was determined as the OCR after FCCP minus non-mitochondrial OCR. Reserve capacity was defined as the difference between maximal OCR after FCCP minus basal OCR. The average of four determinations for each cell line is shown. The horizontal dashed lines represent the average value for each group. Graph details and symbols are explained in the legend to Fig. 4.
