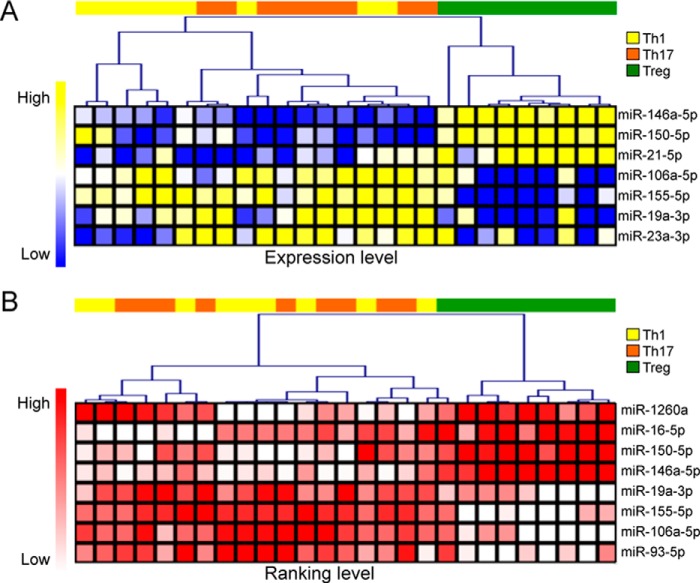
FIGURE 3.
Differential expression analysis of EV-associated miRNAs. Heat maps showing hierarchical clustering of differentially expressed miRNAs (p < 0.05) tested by either ANOVA (A) or Kruskal-Wallis Test (B). For the former analysis, a Pearson metric distance (complete average method) was used on normalized (by miRNA global mean) log-transformed miRNA values; for the latter, a Spearman metric distance was used on ranked Ct data.

