FIGURE 9.
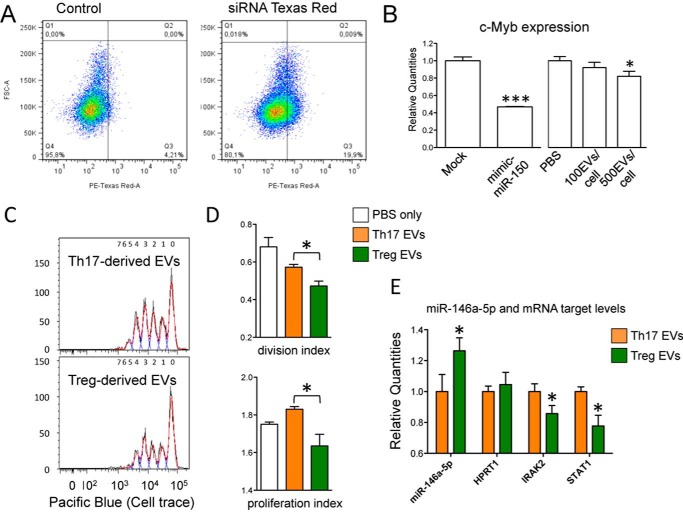
Biological effect of Treg-derived EVs. A, FACS analysis showing the uptake of Treg-derived EVs (transfected with positive control siRNA TexRed) by HuH-7 cells upon 20 h of incubation. B, histogram graph (means with S.E.) showing the fold change (evaluated by RT-qPCR and normalized relative to RNA 18S) of c-Myb when comparing Mock and mimic mir-150-5p transfected HuH-7 cells (left panel, n = 4) or PBS and EVs-treated cells (right panel, n = 6). *, p value < 0.05; ***, p value < 0.001. C, Cell Trace Violet fluorescence CD4+ T cells analyzed by flow cytometry upon 96 h of stimulation with CD3/CD28 Dynabeads in presence of either Th17 or Treg-derived EVs. For each group one representative sample is reported. D, FlowJo proliferation tool was used to calculate the percentage of dividing cells, the division index cells and the proliferation index of Cell Trace Violet Fluorescent CD4+ T cells upon 96 h of stimulation with CD3/CD28 Dynabeads in the presence of either Th17- or Treg-derived EVs (n = 4). PBS only was used as negative controls. E, histogram graph (means with S.E.) showing the fold change of miR-146a-5p and miR-146a validated targets STAT1 and IRAK2 in CD4+ T cells stimulated for 96h with CD3/CD28 Dynabeads in the presence of either Th17- (set to 1) or Treg-derived EVs (n = 4). All parameters were evaluated by RT-qPCR and normalized relative to EV commonly expressed miR-15a-5p (miR-146a-5p) and RNA 18S (all mRNAs). *, p value ≤ 0.05.

