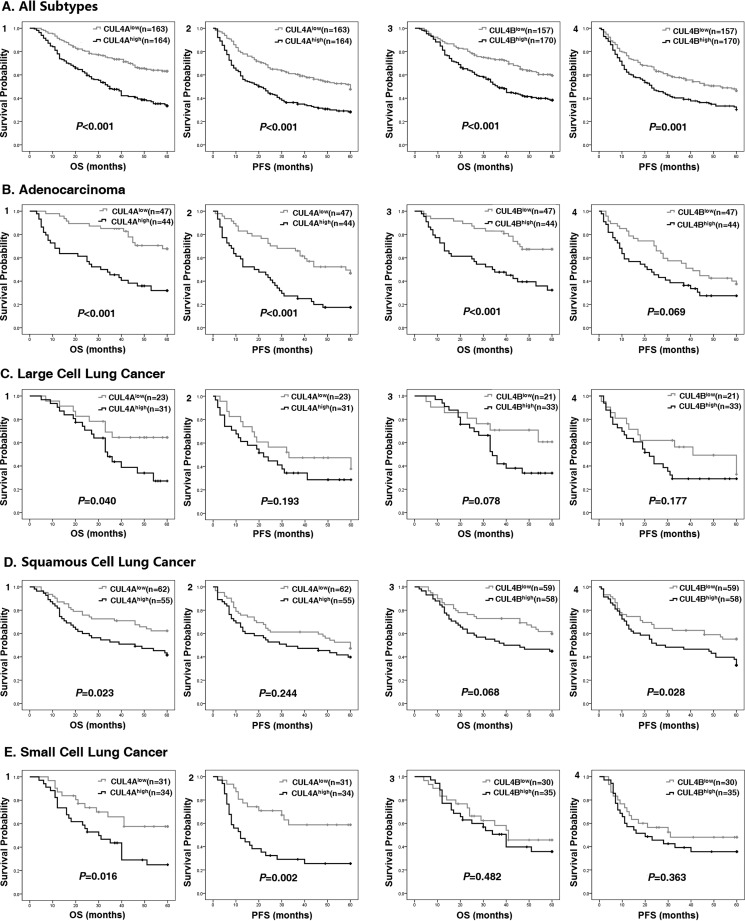
FIGURE 2.
Poor OS and PFS in CUL4Ahigh and CUL4Bhigh lung cancer patients. Kaplan-Meier survival curves based on high versus low expression levels of CUL4A and CUL4B in all patients with lung cancers (A) or subtypes of ADC (B), LCC (C), SCC (D), and SCLC (E) are shown. OS and PFS of CUL4A groups (panels 1 and 2) or CUL4B groups (panels 3 and 4) are shown.

