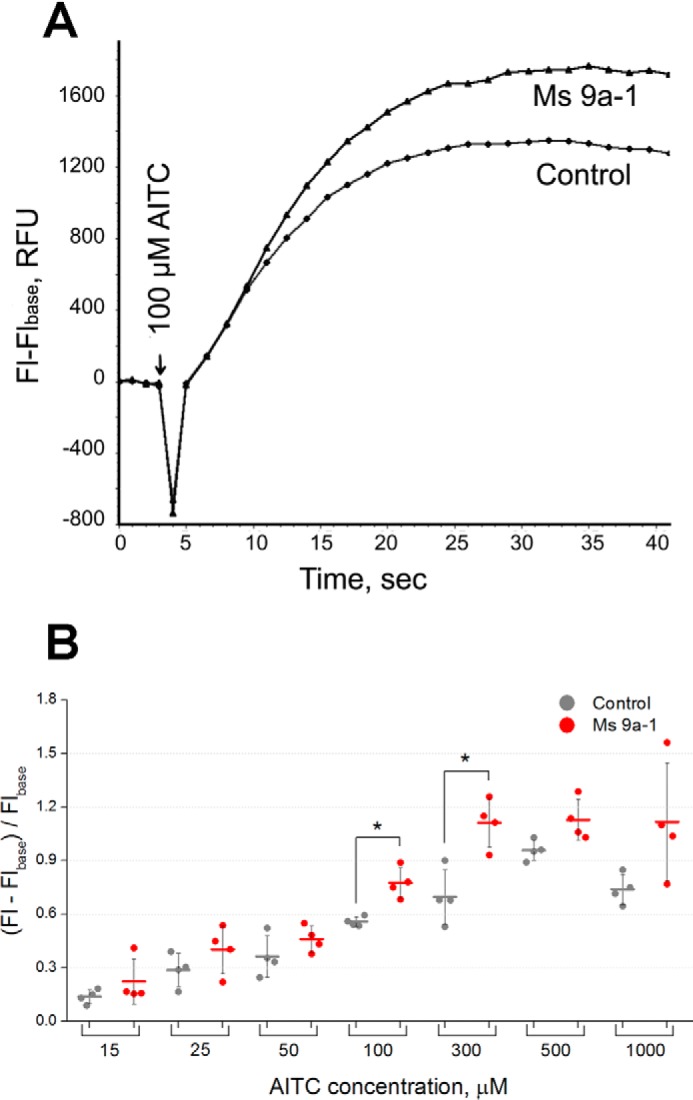
FIGURE 3.

Potentiating effect of Ms 9a-1 on rTRPA1. A, [Ca2+]i responses of rTRPA1-CHO cells to 100 μm AITC in buffer only and in the presence of native Ms 9a-1 (500 nm). The data shown are representative average plots (n = 4) of the fluorescence signals during assays. [Ca2+]i responses were measured as changes in fluorescence intensity before (Flbase) and after agonist addition (Fl). B, variable potentiating efficacy of recombinant Ms 9a-1 (1 μm) with different (15–1000 μm) concentrations of AITC. Data are expressed as the mean ± S.D. (n = 4); *, p < 0.05 (two-tailed t test). RFU, relative fluorescence units.
