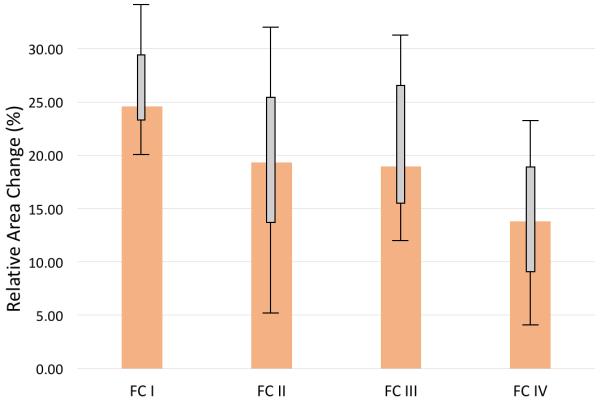
Figure 3.

The median values and corresponding IQRs of aortic area strain among specific WHO functional classes (FC). There was no observed inter-group variability between WHO-FC with respect to the most significantly altered measured stiffness metric – relative area change (RAC) (p = 0.171, Kruskal-Wallis).
