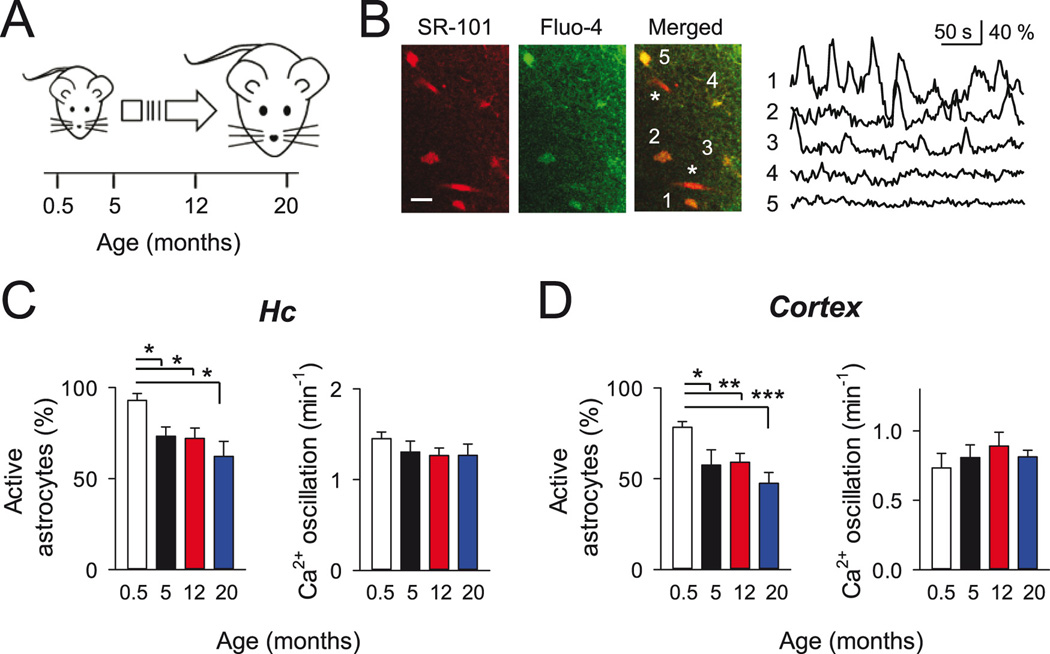
Figure 1. Spontaneous Ca2+ signals in astrocytes during aging.
A: Scheme of different lifetime points selected for analysis. B: Left, pseudocolor images of hippocampal astrocytes (5-month old mouse) showing the colocalization of SR-101 and Fluo-4 fluoresecence signals at the soma of numbered astrocytes. Parenchymal blood vessels filled with SR101 are indicated (asterisk). Scale bar, 20 µm. Right, time course of the intracellular Ca2+ signals from astrocytes indicated in A. Note the presence of spontaneous Ca2+ oscillations in some astrocytes. C–D: Mean percentage of active astrocytes and Ca2+ oscillation frequency at different mice ages for hippocampus (C; n = 90, 86, 118 and 68 astrocytes from 0.5, 5, 12 and 20-month old mice, respectively), and cortex (D; n = 71, 60, 77 and 66 astrocytes from 0.5, 5, 12 and 20-month old mice, respectively). *p < 0.05; **p < 0.01; ***p < 0.001; unpaired t-test and Mann-Whitney rank-sum test. Error bars indicate SEM.

