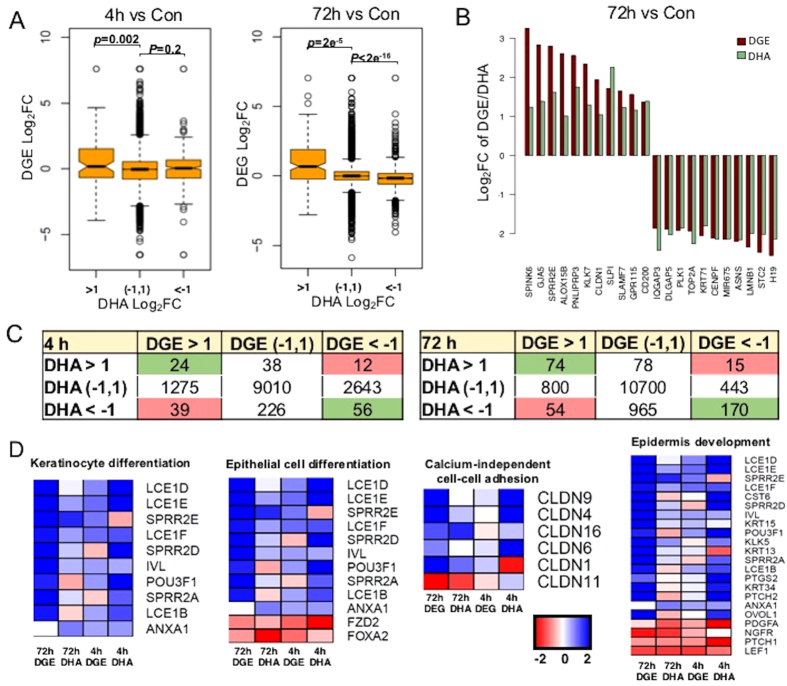
Figure 3.
(A) Integrative analyses of the DGE and H3K27ac DHA gene sets at 4 h or 72 h after UVR. Correlations between gene expression and H3K27ac are considered significant if p < 0.05. P-values were obtained using Student’s t-test by comparing the log2FC of the expression values of the genes from the three DHA groups; (B) Representative genes showing concordant changes in gene expression and H3K27ac following UVR. Cutoff is set at Log2FC > 1 or <−1 for both DGE and DHA; (C) A summary of the overall correlations between DGE and DHA changes among UV-responsive genes at 4 h or 72 h after UVR. Pink highlights positive correlations; green highlights inverse correlations between DGE and DHA; (D) Parallel analysis of H3K27 DHA status of the DGEs that are enriched in top UV-responsive biological pathways.

