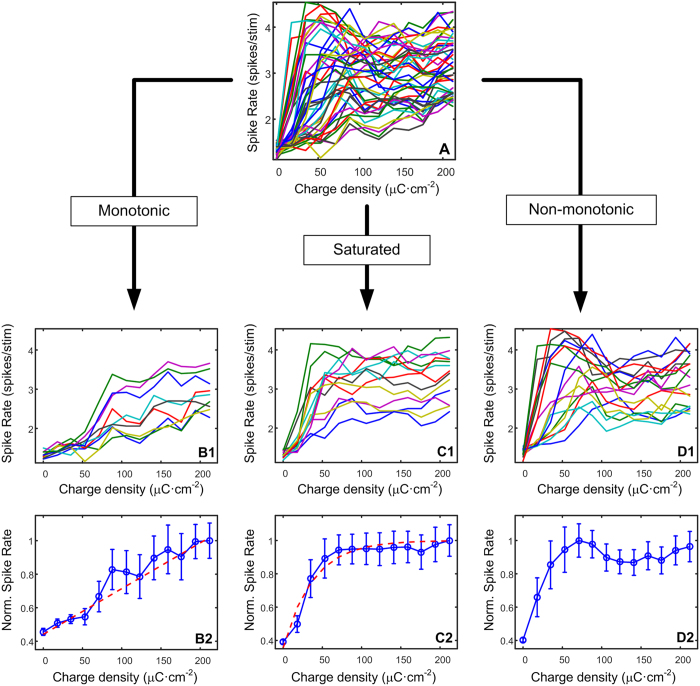
Figure 1. Example of overall responses obtained from one cat.
Panel A shows the spiking rate of all responding channels. B1, C1 and D1 show the spiking rate of monotonic, saturated and non-monotonic channels respectively. B2, C2 and D2 illustrate the normalized average of monotonic, saturated and non-monotonic channels respectively using a confidence level of 95% for the error bars. Note that the dashed line in B2 and C2 represent the linear and increasing exponential decay fit respectively.

