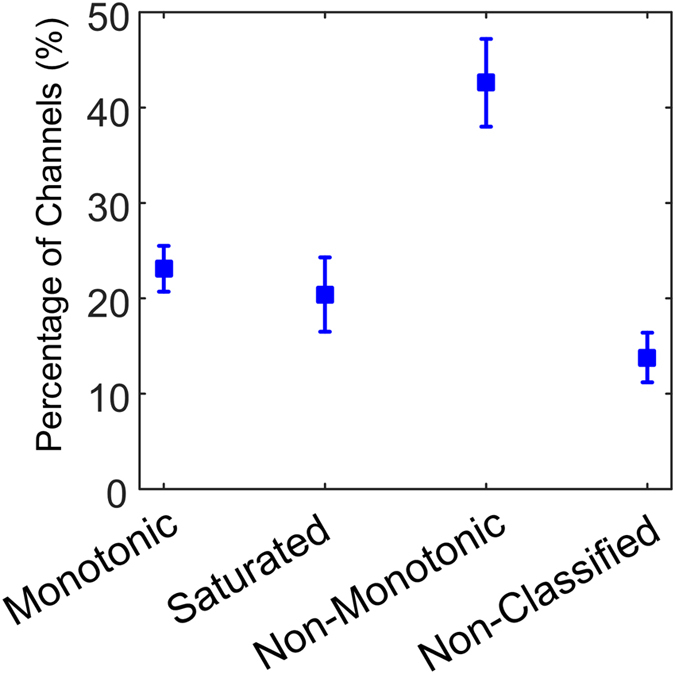
Figure 2. Overall (n = 4) percentage of response type relative to the total number of responding channels per cat.

The number of non-monotonic channels was significantly greater than any other type (p-value < 0.05). Bars represent the standard error of the mean.
