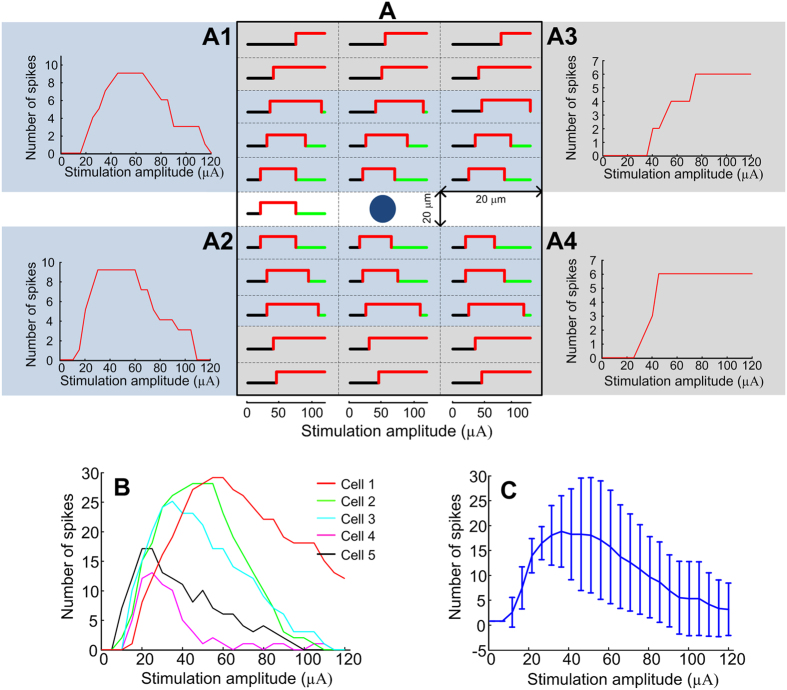
Figure 4. Overall responses obtained after placing the stimulating electrode at different locations separated laterally by 20 μm.
Panel A illustrates the spike elicitation (red) and inhibition (green) curves as a function of stimulation amplitude plotted over tested locations in one cell. The centre blue dot indicates the soma of the patched RGC. Panels A1 and A2 illustrate non-monotonic spike counts when the stimulating electrode was placed near the soma. Panels A3 and A4 show saturated responses when the electrode was placed furthest from the soma. Panel B illustrates the spike count including all 31 locations, as shown in A, for each cell under study. Panel C shows the overall spike count as a function of the stimulating amplitude (n = 5). Error bars indicate standard deviation.

